

Exponentially increasing data volumes, a constantly growing number of apps and systems as well as increasingly complex international regulatory environments are making the fight against financial crime (FinCrime) more and more complex. By using graph analytics, the increasingly complex requirements for compliance reviews can be successfully managed, as the example (provided below) of deployment at a Swiss private bank show.
Before we talk about graph analytics, it is important to understand what a graph is. In mathematical terms, it is an "abstract structure that represents a set of objects together with the connections that exist between these objects ". In everyday life, we encounter graph analysis, for example in social networks, online shopping, or streaming services in the form of "if you liked this series/product/person, you might also like this series/product/person".
In companies, graph representations have been successfully balancing the shortcomings of traditional databases for several years. Structured data, i.e. data that exists in a defined and organized form, is usually stored in tables. The data is linked together by means of unique identifiers. Such databases can store large amounts of data efficiently. However, they are not suitable for identifying and representing relationships in highly complex and interconnected networks effectively. This is where graphs come into play.
Hidden relationships at the click of a mouse
As an example, graph technology was used in a Swiss private bank to bring together the complex and distributed data from internal systems and external databases, as well as data in different formats, in order to prepare them for automated analysis. The bank created a central data store, also called a "data lake", from the following sources, amongst others, which is updated daily:
- Internal data: Data from the core banking system, customer relationship management (CRM), anti-money laundering (AML) and know-your-customer (KYC) databases.
- External data: sanctions list, geodata, data from open-source intelligence (OSINT) queries with World-Check or LexisNexis
As a result, the comprehensive set of information is available to the bank's compliance staff at the click of a mouse in an intuitive and interactive way. For example, they can see at a glance whether a relationship exists between a client and an "entity", i.e. a company that is on the sanctions list, for example. The number of degrees of separation is also displayed. Information such as transactions, addresses, telephone numbers or known relationships can serve as links.
In Figure 1 below, the connection between Dan Koss and the sanctioned Darth Vader is only visible because the graph shows the connection across several degrees of separation via the so-called "flow of funds", i.e. the flow of money, the common address and the relationship.
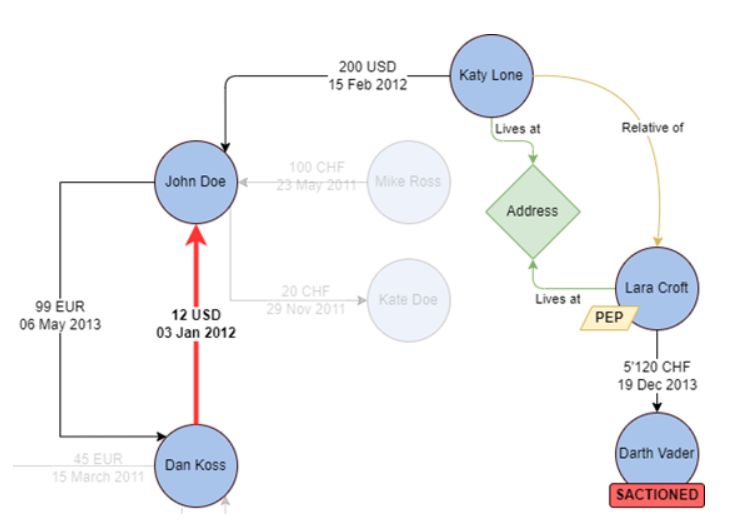
Figure 1: Relationship between Dan Koss and Darth Vader
A graph is worth a thousand words
In a traditional review, compliance teams spend a lot of time manually gathering information from multiple sources to build their understanding of a case. However, with this laborious and mentally tiring work, the information from each data set is conceptually counterintuitive. It also increases the risk of human error or missed connections.
If the same review processes are supported with graph analytics, efficiency gains or time savings of up to 90% can be expected. The time saved by using graph analytics to pull together the information leaves more time for the more mentally demanding assessment of the case.
Figure 2 compares the display of a transaction in the core banking system with the display in a graph-based system.
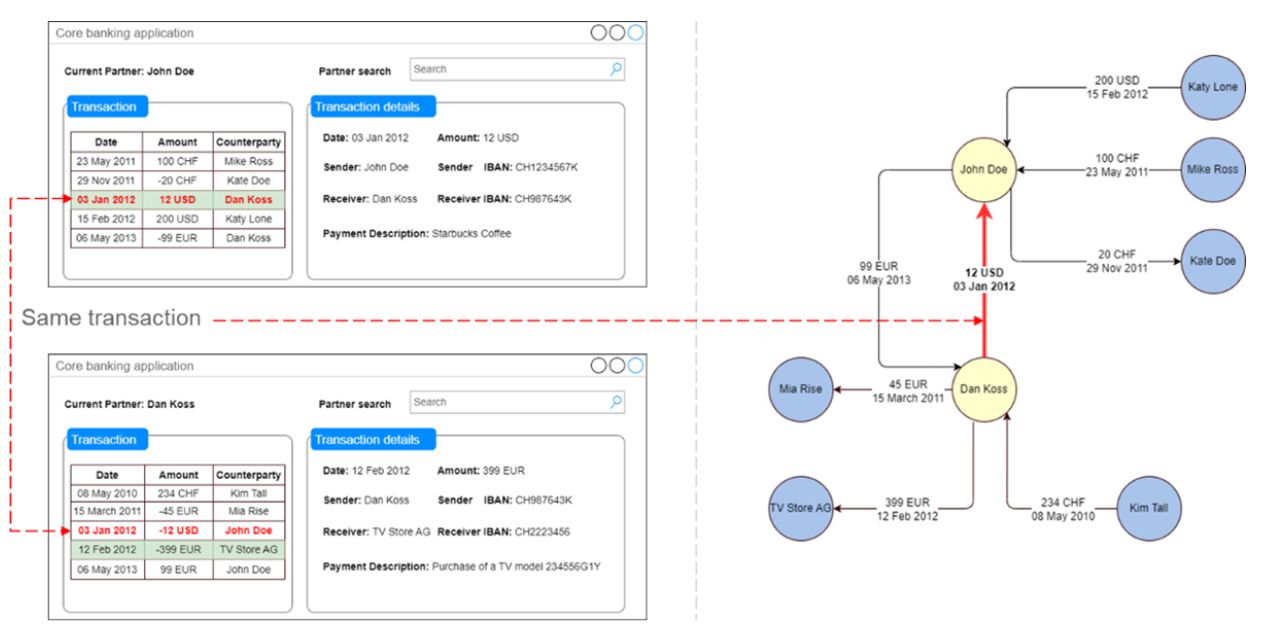
Figure 2: Comparison of core banking system to graph-based system.
In our Swiss private bank example the "Linkurious" software was utilised for graph analysis. Specifically, the tool is used for the following applications:
- Sanctions: Identifying relationships between sanctioned individuals or companies and their accounts, transactions as well as counterparties, also finding indirect links such as shared addresses or boards of directors.
- Asset tracing: showing the flow of funds across accounts and counterparties to detect irregular patterns or potential money laundering activities.
- Know-your-Customer (KYC)/Holistic client view: Holistic risk assessment through a comprehensive understanding of all clients, their risks and their relationship networks.
- Complex structures: Identify hidden relationships and beneficial ownership by untangling complicated ownership structures and corporate hierarchies.
Consolidated counterparty information: In-depth analysis of companies listed under different names in different databases by removing duplicated data and combining the results (deduplication and aggregation).
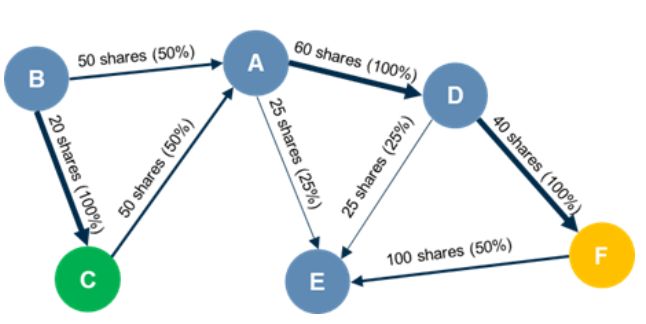
Figure 3: Graph for the analysis of complex ownership structures
Wide range of possible applications
Graph analytics enables the efficient and reliable analysis and assessment of relationships and interconnected data that can only be compiled manually in the conventional method, which is time-consuming and prone to errors. For the Swiss private bank, this means:
- Better detection: by analysing networked data, the bank can detect suspicious patterns, relationships and activities that might go unnoticed using traditional analysis methods.
- Comprehensive risk assessment: The holistic view allows the bank to identify, assess and mitigate risks at both the individual and group level.
- Timely response and improved efficiency: The efficiency of data analysis through prioritisation of relevant information and reduction of manual effort enables the bank to respond directly to additions to sanctions lists, investigations and regulatory requests, minimising the risk of reputational damage or fines.
- Continuous improvement: As new data becomes available, the graph model can be updated and refined to improve the accuracy and relevance of future analyses.
The flexible nature of graphs thus enables a wide range of applications that go far beyond compliance processes. Examples of applications include:
- Economic crime investigation: uncovering complex networks of relationships and connections between individuals, companies and transactions.
- Internal audit: analysing interconnected data points such as financial transactions, employee relationships and access logs.
- Cyber: data traffic, logs, user behaviour.
- Logistics optimisation: analysis of routes or bottlenecks.
- Research: data from clinical trials to identify patterns.
Finally, graph analysis can be used wherever there is a need to uncover hidden patterns, relationships and insights within complex and interconnected data sets.
Originally published December 18, 2023
The content of this article is intended to provide a general guide to the subject matter. Specialist advice should be sought about your specific circumstances.
