In the middle of 2023, we conducted an informal, small-scale survey to gather insights from prominent non-bank lenders on their activity in the net asset value (NAV) lending market for the first half of 2023. We have expanded the survey to cover the full year and to include both lenders (traditional bank lenders as well as non-bank lenders) and borrowers in the US and Europe. Given the size of the NAV lending market, this survey offers broader and more accurate insights into the trends and activity related to NAV lending.
Our survey respondents included secondaries borrowers and lenders. As the secondaries market differs in many respects from the standard NAV lending market, rather than distort the relevant data, the charts included in this report are focused on the data from the standard NAV lending market only and, where appropriate, we have included narrative specific to the secondaries market.
The responses we received in our expanded survey are generally in line with our earlier NAV survey and reaffirm our prior findings, as further shown in this report. The market participants find NAV products to be a useful liquidity solution as they navigate a challenging economic environment.
Please note that although we have broadened the scope of this survey from our previous report and received a significant increase in the number of responses, these findings do not necessarily reflect the entire global market.
Fund Strategy
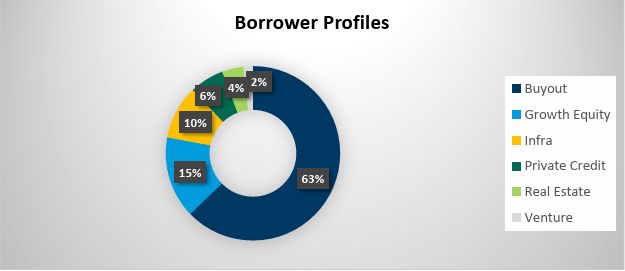
As expected, buyout was the most prevalent borrower strategy. We note, with interest, a larger than expected proportion of growth equity, notwithstanding the higher risk profile of growth equity NAV financings than private credit NAV facilities. This may be explained by the various other types of financings available to private credit borrowers (e.g., CLOs and warehouses) that are not available to growth equity sponsors. Please note, the data below does not include additional strategies such as aviation and sports, in addition to secondaries.
Facility Size
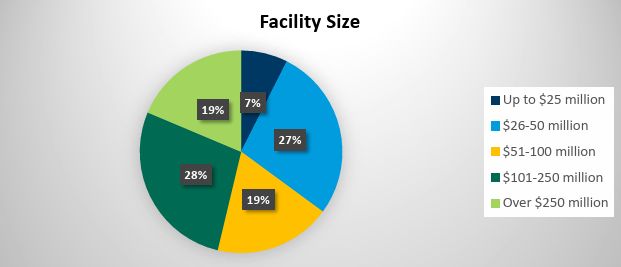
The most prevalent deal range response was $101-$250 million, with the $51-250 million range making up nearly half of all responses. Smaller commitment sizes in the NAV market may reflect the continued use by many funds later in their lifecycles with relatively few assets (with smaller aggregate NAV profiles) remaining in their portfolios. By contrast, when separately asking a select number of secondaries borrowers and lenders we saw responses in excess of $250 million (with a few exceeding $1 billion), reflecting the growth we have seen in the secondaries market in recent years.
Lender Composition
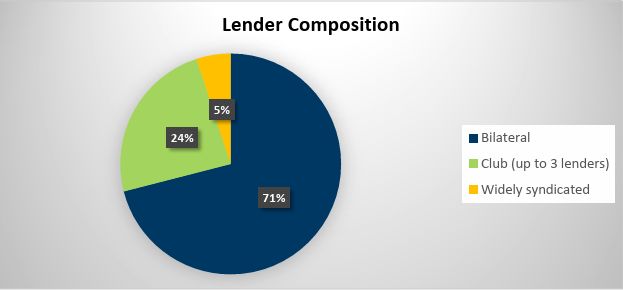
Both lenders and borrowers were consistent in confirming that bilateral NAV transactions and club deals (which are often initially structured as bilateral facilities) were the most prevalent structures. This response may be explained by the smaller commitment sizes commonly seen in the NAV market.
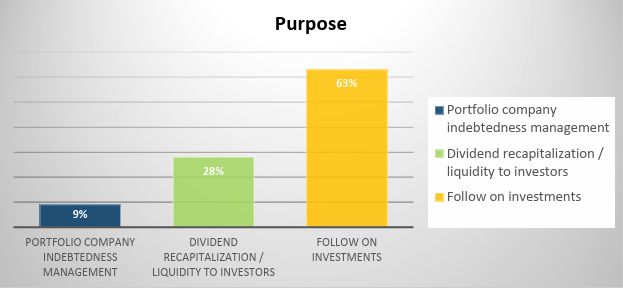
Purpose
NAV facilities were predominantly used for acquiring additional portfolio investments and follow on investments. The responses align with the view that NAV financing has been a partial replacement for more traditional LBO debt financing. In relation to secondaries facilities, the most common use of proceeds was to fund the initial portfolio acquisition.
To read this article in full, please click here.
Insights On The NAV Lending Market – Full Year 2023
The content of this article is intended to provide a general guide to the subject matter. Specialist advice should be sought about your specific circumstances.
