

For lawyers and accountants who create structure charts on a regular basis, the process can be time-consuming and fairly involved. Structure charts are valuable communication tools to connect and engage with clients. However, the work is often non-billable for the practitioner, as well as the colleagues and senior staff who spend time on reviews and revisions.
But why do structure charts take so much time to build? The majority of firms rely on conventional diagramming tools that are not intended for corporate planning, tax planning, trust and estate planning, private equity planning, and similar areas. Lawyers and accountants are stuck using generic tools for very specialized work.
With the right tool and approach however, you can fly through diagrams and reduce hours of work to minutes. We're going to look at the five strategies you can adopt today to build client-ready diagrams faster (and better) than ever before.
- Get started with templates
- Leverage pre-set labels
- Streamline communication with improved collaboration
- Take a client-focused approach
- Duplicate diagrams for multi-step structures
1. Get started with templates
Conventional diagramming tools today lack a lot of the specialization that lawyers and accountants need to breeze through their structure charts. Many settle for using PowerPoint, Visio, or even Excel to create diagrams. One practitioner can spend dozens of non-billable hours drawing up a diagram each month relying on these tools.
Starting with actual pre-built templates by comparison is the fastest alternative. Using templates for complex reorganizations, multi-step transactions, trust and estate planning and other areas provides you with a substantial head start. The majority of shapes you need are there, along with placeholders for information you want to include.
Blue J Diagrams has a number of Quick Start Templates that users can access, edit, pull together, and share with colleagues across the firm. Save your custom structure charts to use as starting points for future clients, or share with team members to provide everyone with a set of diagramming resources.
2. Leverage pre-set labels
When adding labels to shapes in any structure chart, the conventional approach would be to create text boxes, resize them, and place them over the shape. This then gets repeated for every shape throughout the structure chart.
Again, we run into the issue of efficiency – dragging and dropping individual text boxes onto everything that needs one can be time consuming (and not to mention monotonous). Then there is the issue of consistency, whether it's within the same diagram, same set of diagrams, or diagrams from practitioners across the firm. Are all the labels always the same and following accepted conventions? Do they vary from one practitioner or team to the next? Do reviews take longer due to labeling inconsistencies?
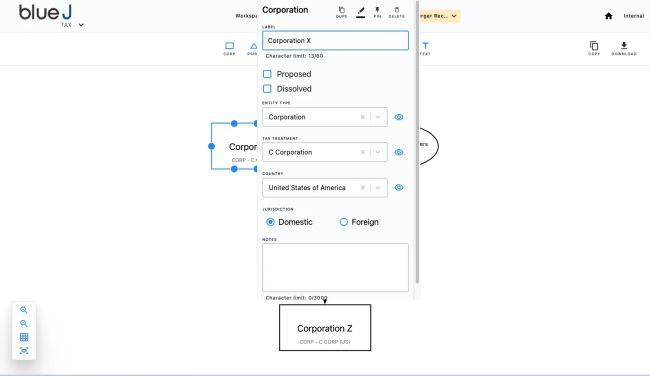
Rather than deal with any of that, leverage pre-set labels. With the right tool, the field for where a label is placed on a shape and the options to select from are defined. This way you can enter all the data pertaining to a structure, along with the label, and it is visualized for you.
3. Streamline communication with improved collaboration
When diagramming out structure charts, practitioners may need to get senior-level staff to review it, colleagues to provide their expertise, or actively work together with others to plan out something comprehensive. In days past, a team may share an office space with a white board and map things out. Today, the world of work has changed substantially with remote-first or hybrid-style arrangements.
Sending emails back and forth, losing track of notes, and losing track of the most up-to-date structure charts can be a chaotic, inefficient process. However, many tools today offer collaboration within the platform itself.
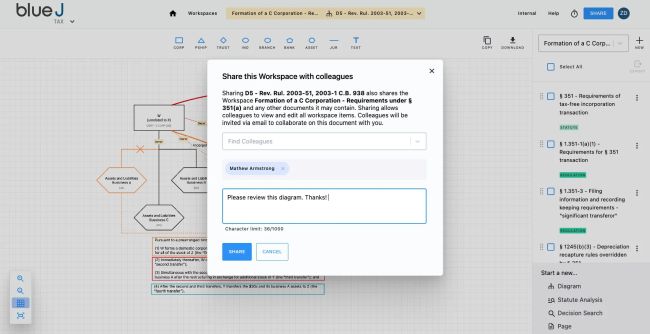
This means you can now share a diagram or set of diagrams with team members in the firm, request their review or input, leave notes in the diagrams for others, and even work together on making changes in real time. In a way, the whiteboard has become digital and allows team members to work together from anywhere.
4. Take a client-focused approach
Corporate diagrams and other forms of structure charts are functional, they serve a purpose, which is to communicate complex information visually to help your clients understand what is being proposed.
It's common for standard structure charts to be black and white, plain, and very simple. There is nothing wrong with this approach. A clear diagram is a good diagram. However, with a client-focused approach to diagramming, you can elevate how well you communicate with and engage your clients using diagrams.
Adding color and incorporating logos can be a simple and effective way to present diagrams that are clear, professional, and appear well thought out to your clients.
Adding colors to draw attention to certain types of structures, actions or text fields makes those pieces of information stand out. Finding ways to incorporate your clients' brand colors throughout, and adding their logo to the finalized diagram is an added level of personalization and attention to detail. Every client wants to feel as though they have every bit of your attention and focus. These small touches help to convince your clients of that and demonstrate a level of professionalism within the firm that competing firms may not have yet.
5. Duplicate diagrams for multi-step structures
Duplicating diagrams for multi-step structures sounds simple. However, traditional tools do not make it easy. With PowerPoint the size of the canvas is limited to begin with, so while duplicating slides may work just fine – complex and clear the diagram can be, is restricted. Meanwhile, in Excel, some lawyers will settle for creating diagrams by duplicating tabs within a sheet. This is a time-consuming workaround,
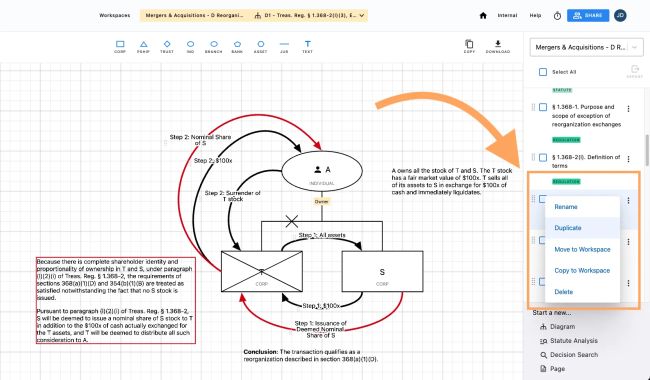
With Blue J, your diagram exists within a Workspace. You can duplicate any diagram you're working on, which adds a new diagram to the Workspace. You can title it and it's ready to be edited. The diagrams are listed out in a side panel within the editor and can be reordered at any time, and also copied over to new Workspaces if need be. Within the editor, you have a clear line of sight into each of the steps within the multi-step structure, and can navigate through it with ease if presenting to a colleague or client.
These are just a few ways to cut down on the time spent visualizing structures. But getting started with the right tool is key. Many practitioners either spend hours using a sub-par solution or rely on others to visualize their hand-drawn diagrams (typos, scrawls and all). Many even avoid diagramming altogether due to how much time it can take.
Diagrams are effective tools for problem solving and analyzing collaboratively, and play a fundamental role in delivering the best insights to clients. With an efficient way to tackle even the most complex diagrams, non-billable hours are cut down and the room for more substantive work becomes available.
The content of this article is intended to provide a general guide to the subject matter. Specialist advice should be sought about your specific circumstances.
