
Up Rounds vs. Down Rounds: An Indicator Of The Overall Investment Climate
One of the questions that investors and entrepreneurs often ask is, "What is the overall investment climate for venture-backed companies, and is it improving or getting worse?" There are a number of different indicators one can look at that help answer that question such as the number of start-ups that have received venture funding, the aggregate amount of venture capital that has been invested in private companies and the trend in median pre-money valuation of venture-backed firms at various stages of development (a subject that was discussed in the Q4 2006 Private Company Financings Report).
One of the other indicators that can be used to help gauge the overall investment climate for venture-backed companies is the percentage of up round financings for a given period. An up round refers to a financing transaction in which the investors in the latest round of financing pay a higher price for the company’s securities than was paid in the previous round of financing, while a down round occurs when investors pay a lower price than in the previous round. If the percentage of up round financings is high, the investment climate is relatively strong. On the other hand, if the percentage of down round financings is high, the investment climate is relatively weak.
To fully understand the trend in the investment climate one needs to look past the results of the most recent quarter and examine the results of the last year or more. Only by looking at the long-term trend lines will one begin to know whether the investment climate is getting stronger, staying the same or getting weaker.
To demonstrate how up rounds and down rounds can be used to help one understand the investment climate, we have pulled together the results of the last four years of transactions with which we have been involved (see chart below).

In reviewing data from the last four years, one has to keep in mind the financing environment during the dot-com boom and immediate aftermath of the crash. As the dot-com boom got underway, the number of up round financings increased substantially because investors kept giving companies higher and higher valuations. When the dot-com crash took place the reverse occurred. The number of down round financings increased because follow-on investors were not willing to value companies as high as previous investors had valued them. The lingering effects of the crash continued for several years.
In early 2004 the investment climate for venture-backed companies began to change, as indicated by the fact that the number of up round financings began to exceed the number of down rounds. But as one of our partners, Ryan Naftulin, described the situation, "the valuations were so low that there was only one way to go and that was up." Since that time, the investment climate remained relatively strong, with up rounds accounting for an average of 76% of all transactions during the last two years. The percentage of up round financings continues to be strong, accounting for 78% of all transactions in which we were involved in the second quarter of 2007.
Executive Summary On Private Company Financings In The Second Quarter Of 2007.1
Deals over the last three quarters have been fairly steady in their breakdown, with early- stage financings (Series A and Series B) accounting for around two-thirds of all deals.
Median pre-money valuations for early-stage financings declined in the second quarter from their recent highs. Series A median pre-money valuations dropped from $9 million in the first quarter of 2007 to a still respectable $7.2 million in the second quarter of 2007, and Series B median pre-money valuations dropped from $25 million to $20 million in that same time period.
By contrast, median pre-money valuations for later stage companies strengthened in the second quarter after declines in recent quarters. Series C median pre-money valuations increased slightly from $39.5 million in the first quarter of 2007 to $40 million in the second quarter of 2007, and Series D or later stage financings jumped from a recent low of $43.75 million to $66 million in that same time period.
In keeping with the theme of stronger later stage financings, the percentage of up round financings remained extremely high. Up round financings accounted for 78% of all transactions in the second quarter of 2007, up from 68% in the first quarter of 2007 and consistent with the second half of 2006.
This reporting period also found the biggest increase in the number of pay-to-play deals. Over the last six reporting periods, this number of deals (14%) surpasses the previous high (13%) from the first quarter in 2006.
DEAL BREAKDOWN—By Series. The deal breakdown by series in the second quarter remained virtually unchanged from the first quarter, with early stage financings (Series A and Series B) still accounting for two-thirds of all deals in our study.

MEDIAN PRE-MONEY VALUATION (millions $)—By Series. Pre-money valuations fell in Series A and Series B financings, but remained flat in Series C and rose in Series D and later stage transactions.

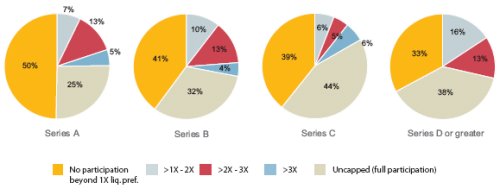
PREFERRED STOCK PARTICIPATION—By Series. Series A financings showed the greatest percentage of non-participating preferred terms, demonstrating the relatively strong start-up market, while Series C and Series D or later stage financings showed a greater percentage of uncapped or high capped participation.
DEALS WITH PAY-TO-PLAY. The number of deals pay-to-play provisions increased in the second quarter to their highest number in these six reporting quarters, but remain a relatively low percentage of all transactions.

ABOUT COOLEY. Cooley Godward Kronish’s 600+ attorneys have an entrepreneurial spirit and deep, substantive experience, and are committed to solving clients’ most challenging legal matters. From small companies with big ideas to international enterprises with diverse legal needs, Cooley has the breadth of legal resources to enable companies of all sizes to seize opportunities in today’s global marketplace. The firm represents clients across a broad array of dynamic industry sectors, including technology, life sciences, financial services, retail and energy.
ABOUT THIS REPORT. This quarterly report provides data from 2006 and 2007, reflecting Cooley Godward Kronish’s experience in venture capital financing terms and trends. Information is taken from transactions in which Cooley Godward Kronish served as counsel to either the issuing company or investors.
Footnotes
1. Analysis is based on 71 completed deals in the second quarter of 2007.
The content of this article is intended to provide a general guide to the subject matter. Specialist advice should be sought about your specific circumstances.