It has now been 6 months since the introduction of the Unitary Patent (UP) and the Unified Patent Court (UPC) – so how many UPs have been requested? And who is requesting them?
The UPC Agreement (UPCA) came into force on 1 June 2023, paving the way for the European patent with unitary effect (UP). Patentees are now able, within one month of grant of their "classical" European patent (EP), to request unitary effect. The resultant UP acts as a single patent with territorial scope extending to the 17 EU states that have currently ratified the Agreement. This is a significant departure from the classical EP, whereby patentees have to individually validate their granted EP into their European Patent Convention (EPC) contracting states of choice, resulting in a bundle of individual national patents. It is important to note that while non-EU states such as the United Kingdom or Switzerland are unable to be party to the Agreement, this does not stop such applicants from obtaining Unitary patents.
Much has been written about how the new system works, and whether to request unitary effect or not – check out our comprehensive guides here. In this article, we will provide some analysis and insight into the first 6 months in data, obtained from the European Patent Office's (EPO) Statistics and Trends Centre. This resource provides some raw numbers on how many unitary effect requests the EPO have received, breaking the requests down by technical and geographic indications. As of 30 November 2023, there have been 15,009 requests – is this a lot, or just a small fraction? To make sense of this data, we need to frame it in the context of the wider European patent system.
What proportion of European patents are Unitary patents?
As unitary effect can only be requested after grant of a classical EP, the amount of UP requests can be calculated as a proportion of the total granted EPs, giving an idea on overall uptake of the new system. Taking data from the European Patent Register, Figure 1 shows the number of EPs grantedand unitary effect requests received by the EPO for January to November 2023.
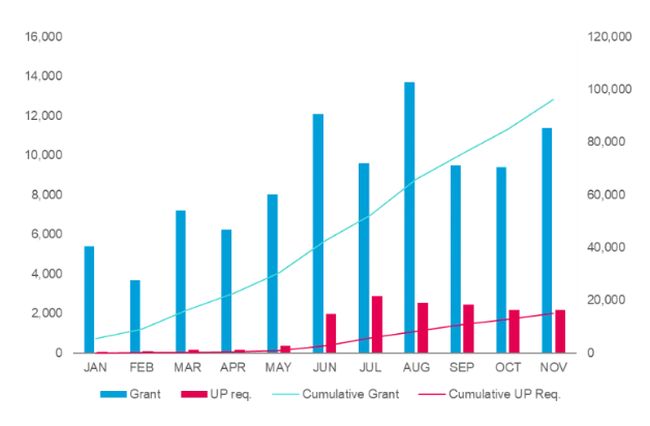
Figure 1: The number of EPs granted and UPs requested in 2023 so far.
The 15,000 unitary requests up to December 2023 represents 14 per cent of the 104,611 EPs granted in 2023. While requests for unitary effect can be received by the EPO on any office day, the mention of grant of an EP only occurs when the weekly EP Bulletin is published, typically each Wednesday (months that have 5 Wednesdays are responsible for the peaks on Figure 1). However, the latter data appears on the European Patent Register early, thus we can already see how many EPs will be granted for the entirety of 2023. Clearly, the majority of patentees are still opting for national validation. It is interesting to note the overall trend in EPs granted; the first five months of 2023 started with similar numbers granted each month in 2022 (average of 6,110 vs. 6,813 per month, respectively). However, we see a large and somewhat sustained inflation following the introduction of the UP on 1 June 2023, resulting in an average 10,580 EPs granted in the last seven months of 2023.
The reasons for this inflation may be two-fold. Firstly, from the start of 2023, the EPO gave applicants the option to delay grant of their EP until the introduction of the UPCA, and optionally also to make an early request for unitary effect. The EPO only report 846 requests before June, which certainly does not account for the 73 per cent increase in average monthly EPs granted. It seems that some applicants delayed grant of their EP – either through the official means or by strategic delays – but did not make an early request. Rather, they were waiting to see how the situation unfolded once June came around. However, it is difficult to ascertain how many applicants may have done this.
Furthermore, it is likely that the number of EPs granted is progressing towards previous levels. Figure 2 shows the number of EPs granted each year from 2013 to 2023; in 2019 the EPO reached a peak of almost 138,000 patents granted, but this had declined by 41 per cent to 82,000 in just 3 years. This reduction in grants is not due to a reduction in applications – from 2013 to 2022, there has been a gradual increase averaging 3 per cent per year in the number of applications received by the EPO, from 148,027 to 193,460. It is our understanding that the EPO had a significant search backlog that, in recent years, has been prioritised over examination. The EPO's 2022 Annual Review includes an in-depth 'Quality Report' – in section 5, the EPO presents some interesting data on the timeliness of search and examination over the past few years. Now this has supposedly been dealt with, the EPO has granted 28 per cent more patents in 2023 than in 2022. Has this jump simply happened to coincide with the introduction of the UPCA? Nonetheless, while it may appear as if the UP is the driving force behind the increased grant rate, it is likely the result of a combination of factors.
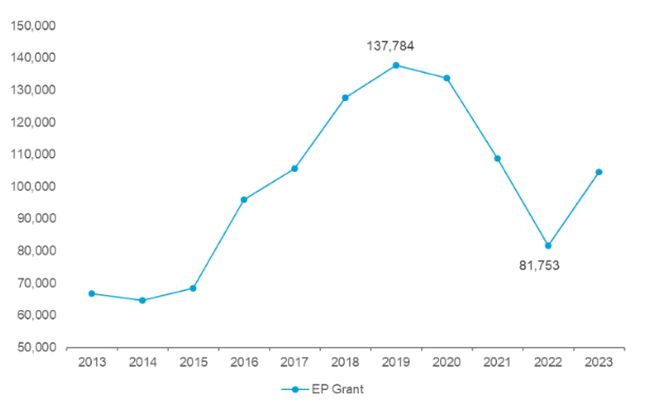
Figure 2: Number of EPs granted per year, from 2013 to 2023.
Which sectors and industries are requesting unitary effect?
The EPO's Statistics and Trends Centre also breaks down the number of unitary requests for individual technology areas. The EPO breaks down their data into separate technology areas using the WIPO IPC Technology Concordance Table. The individual classifications under each technology area are worth looking into; for example, new chemical entities or biologics may not necessarily be covered by the 'pharmaceuticals' category, but instead come under 'organic fine chemistry' and 'biotechnology', respectively. Additionally, this data has been collated for applications and granted EPs by the EPO in their annual Patent Index reports, which allows us to get an idea of which sectors are favouring unitary protection over individual validation. Figure 3 shows the proportion of selected technology areas that make up 2023 UP requests, 2022 EPs granted, and 2022 EP applications. While we understand there will be some discordance in the data between applications vs. grants, and between years, such data is not yet readily available for 2023. Nonetheless, when comparing, for example, application data between years, it is apparent that significant changes tend to occur over a period of several years, rather than year-to-year.
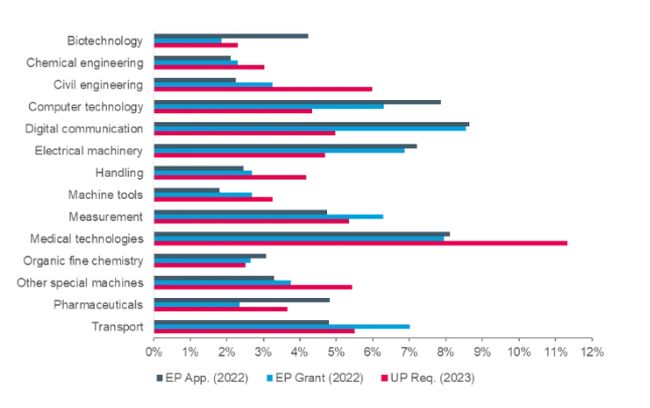
Figure 3: Selected technology areas and their proportion of EP applications (2022), EP grants (2022), and UP requests (2023) as a whole.
What immediately stands out is the prominence of 'medical technologies' as a proportion of UP requests, constituting 11 per cent of all requests. While the field certainly makes up a large number of total applications and grants (both 8 per cent in 2022), the greater proportion of UP requests suggests that proprietors of such technology are favouring the new system. The reasons for this may be due to the nature of the sector – are there more small companies developing medical devices? The cost savings of the UP may be very appealing to small and medium-sized enterprises (SMEs) with relatively niche products, or start-ups engaging in IP‑driven fundraising. On the other hand, a larger institution with a greater IP budget may prefer to opt for the perceived security that comes with the classical EP's national validation and litigation. That is to say, the costs of validation and translation (among other things) may outweigh any fears of a central action brought by the UPC on a Unitary patent.
'Civil engineering' takes second place for UP requests, with 6 per cent; as with medical technologies, the proportion is significantly higher than the respective chunk of EP grants and applications. Could this relate to how litigious these two industries are? Recent data shows that both the medical devices industry and the construction industry are some of the least litigious – if there's little risk of UPC proceedings against a UP in these sectors, why not opt for vast coverage at a low cost?
This point may extend to what we are seeing with 'computer technology' and 'digital communication' – these are some of the most dominant technology areas with regards to patent applications, but have taken somewhat of a backseat in UP requests. As you may expect, these industries are some of the most litigious. Furthermore, in our experience we have found such sectors to typically only validate their EPs in the so-called 'big three' – the UK, Germany, and France. If European patent protection is only sought in these states, classical EP validation is likely to be the best option.
Which countries and regions are requesting unitary effect?
We are also able to examine UP requests by country, and compare with the same data for EP applications and grants (Figure 4). While EPC contracting states do account for the plurality of EP applications and grants (43 and 45 per cent, respectively), they account for a significant majority of UP requests. While the EPO breaks down EP applications and grants by country in tabular form, such UP request data is instead in the form of a map. It is quite tricky (nigh on impossible...) to select smaller states such as Lichtenstein, Luxembourg, Hong Kong, Singapore etc. Therefore, the data we've displayed for UP requests from all combined EPO states is an estimate, but should be fairly accurate. This shows that the new system is being driven by EPC contracting states. In contrast, the United States, Japan, China, and Korea are together responsible for around half of all EP applications and grants, but just a quarter of UP requests. This shows a clear hesitance towards the UP from outside of Europe, particularly so for Japan – could these trends be related to a lack of familiarity with the new system? Or could it be related to a country's industrial makeup?
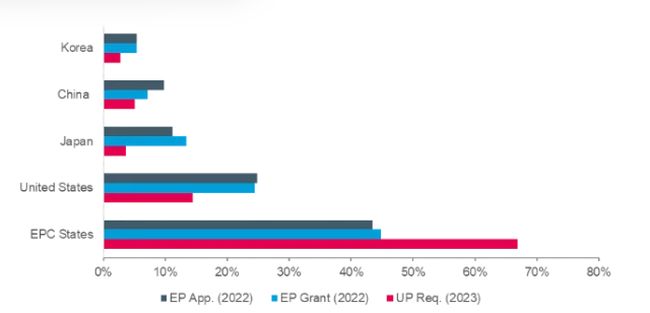
Figure 4: The EPC states and the four major non-EPC states by their proportion of EP applications (2022), EP grants (2022), and UP requests (2023) as a whole.
When looking at the same data for the top 12 filers of the EPC states, we can see that they are all requesting a greater proportion of UPs than their relative shares of EPs (Figure 5). While Germany is the dominant European filer (15 per cent of applications and 19 per cent of UP requests), the relative amount of UP requests coming from smaller filers such as Denmark and Spain should not be underestimated. 774 European patents were granted to Danish proprietors in 2022, and they have made 474 UP requests in 2023 so far. Again, does the industrial makeup of a country provide any insight?
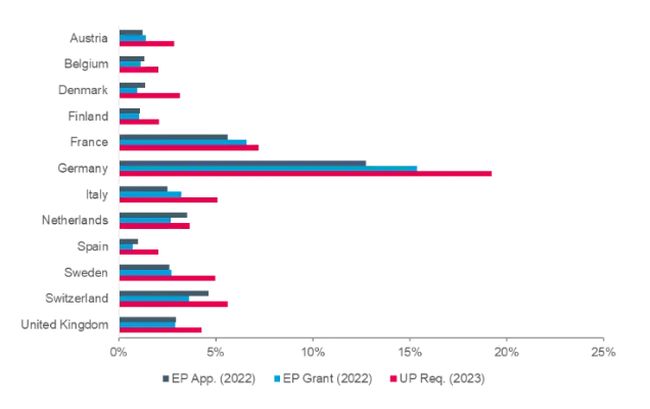
Figure 5: The top 12 filing EPC states by their proportion of EP applications (2022), EP grants (2022), and UP requests (2023) as a whole.
Are particular industries in individual states driving the trends?
To finish off our analysis, we will look at the technology areas responsible for filing and requesting in individual states – note that the EPO does not provide such data for granted EPs. Starting at the top, we can see that the German engineering industry is responsible for a large number of UP requests (Figure 6). Broadly speaking, the top three technology areas for UP requests and the top three for EP applications were chosen to display in the figures, or any that had notable disparity. 'Civil engineering' and 'other special machines' does make up a combined 15 per cent of Germany's requests, but no other industries particularly stand out, suggesting a broadly positive reception to the UP across the country.
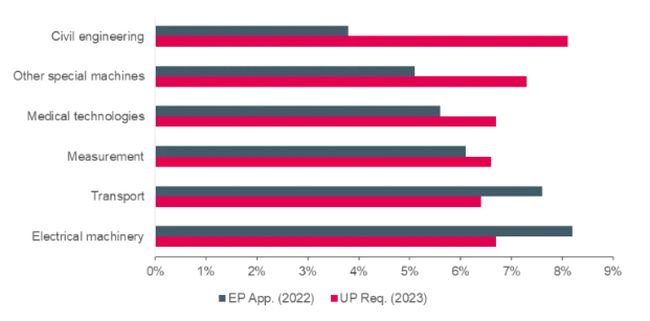
Figure 6: Selected German technology areas and their proportion of EP applications (2022), and UP requests (2023) as a portion of all of Germany's.
While European applications from the United States are somewhat broadly distributed among different sectors, medical technologies are responsible for over 20 per cent of US UP requests (Figure 7), which results in a not insignificant 3 per cent of all Unitary patents. As previously shown in Figure 3, the medical technologies sector as a whole is notably prolific in UP requests, and the US makes up over a quarter of that number. This shows that despite the US making relatively few requests on the whole, this particular sector is currently a key player in the overall make-up of Unitary patent data.
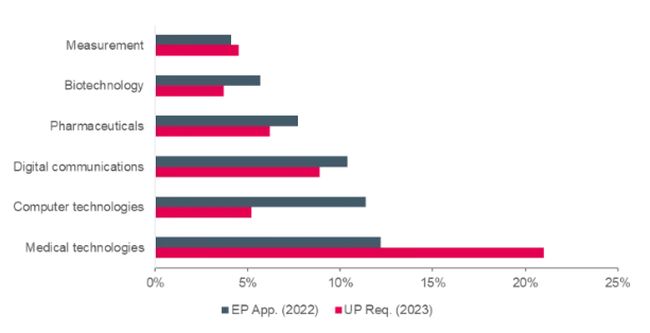
Figure 7: Selected US technology areas and their proportion of EP applications (2022), and UP requests (2023) as a portion of all of the US.
In the reverse situation, applications from China are heavily dictated by the digital communications sector (25 per cent), but UP requests are split more evenly (Figure 8). This is likely to be a driving factor in China's relative hesitance towards the Unitary patent.
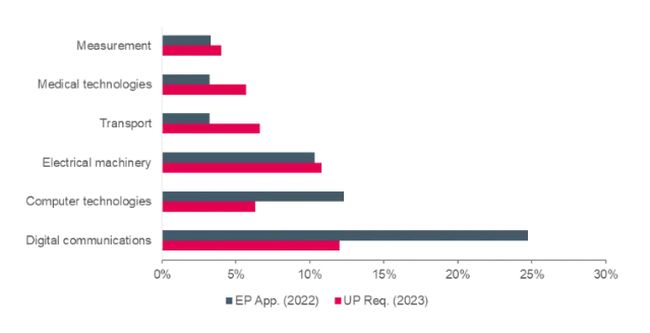
Figure 8: Selected Chinese technology areas and their proportion of EP applications (2022), and UP requests (2023) as a portion of all of China's.
Lastly, we can try and investigate why a great proportion of Danish proprietors are opting for unitary protection. At first glance, it is interesting to see the prominent proportion of EP filings from the biotechnology industry fall significantly when it comes to UP requests (Figure 9). While this may be expected when considering the high-value products that such patents protect – and the highly litigious nature of the industry – it is important to note the discrepancy in grant rate. Looking back to Figure 3, we can see that relatively few biotechnology patents have been granted recently, despite applications being on the rise. Looking at the EPO's Statistics and Trends Centre, we can see that, from 2013 to 2022, biotechnology applications have increased – on average – 5 per cent a year. However, in the same time period, the number of biotechnology patents granted has decreased 27 per cent overall. 2021 to 2022 alone saw a 40 per cent reduction. This may relate to the backlog previously described, with the biotechnology sector yet to catch up with other technologies.
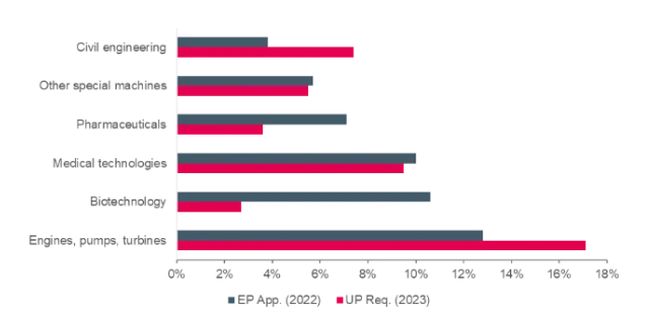
Figure 9: Selected Danish technology areas and their proportion of EP applications (2022), and UP requests (2023) as a portion of all of Denmark's.
These points aside, there is no particular sector that stands out – it may just be that there is a positive reception to the system in Denmark, and a desire to make benefit of it. It is interesting to note that Denmark was the only country to put the question of whether to sign up to the UPCA to the public, in a referendum carried out in May 2014. 2.3 million Danes voted, with 62 per cent voting in favour. Surely the innovators and entrepreneurs of a country that put the Unitary system into the public discourse are a) more likely to know it even exists and b) understand what the benefits could be!
As we've seen, uptake of the unitary system is modest, currently at 14 per cent. However, we're yet to have a full year of European patents with unitary effect – it will be exciting to see what happens over the next 6 months. Nonetheless, the trends behind the 15,000 UP requests received by the EPO so far appear to be driven by the sectors and states that can immediately see the potential benefits to them. While European states are responsible for the bulk of filings, particular industries from other countries, notably the US medical technology sector, should not be underestimated. Once the new system settles in alongside its 50-year-old neighbour (the EPC), it should be interesting to see what other states and sectors embrace it.
Considering Denmark's large proportion of requests, we are inclined to believe that the Unitary system is best exploited when patentees are informed and up-to-date. For further information and updates, visit our UP/UPC resources or contact a European patent attorney.
The content of this article is intended to provide a general guide to the subject matter. Specialist advice should be sought about your specific circumstances.