Our analysis of the LLP financial statements submitted by the top 100 law firms throws up some interesting trends.
The legal sector appears to be holding up relatively well, according to financial statements available for the year ended 30 April 2010, despite the difficult trading conditions during this period, according to our latest analysis of published accounts. However, there are some significant variations in financial performance according to size of firm. We will await 2011 results with interest to see whether there are further signs of erosion of the top firms' dominance and whether some of the less well performing firms have managed to turn the corner.
Signs of a shift?
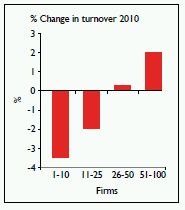
Fees generated by the top ten law firms fell by just over 3% on average in the year ended 30 April 2010. Firms ranked 11 to 25 show an average 2% fall compared to the previous year. By contrast, firms in the 26 to 50 group have consistently maintained fee levels, while firms in the 51 to 100 range have seen just over a 2% increase in fee levels on average. This seems to support anecdotal evidence that smaller firms are challenging the offering of larger firms, and we will watch with interest to see whether this shift becomes a more pronounced trend.
Staff costs
Staff costs as a share of turnover have remained broadly consistent across all sizes of firm among the top 100 – averaging between 40% and 45% of fees over the last two years. Firms in the 26 to 50 group are the most consistent, with their staff-to-fees cost percentage at a static average of 40%, while the average for all other categories of firm has fallen marginally.
Fees and profit per member
Fees per member remained fairly static compared to the previous year. There was a fall in the number of members in the top 25 firms, against a slight increase in the number of members for the 26 to 100 range. Average fees per member were just over £2m for the top ten, just over £1m for 11 to 25, just below £1m for 26 to 50, and just over £500,000 for the 51 to 100 bracket.
In terms of profitability, all but the top ten have shown increases compared to the previous year. However, the top ten are still significantly more profitable than the rest, with average profits per member at over £650,000, compared to the lowest group of 51 to 100, with average profits per member of just below £200,000.
Working capital
Across all top 100 firms, there has been a fall in the number of days that clients take to pay invoices. The largest fall in debtor days is for firms in the top ten, which have achieved an average reduction of over 30 days to just over 100 days in total.
Total lock-up, however, has only improved for the top ten. Taking into account recorded levels of work in progress, all other firms have shown on average an increase in total lock-up levels over the last two years.
It is perhaps surprising to see an increase in total lock-up, given increased pressure on law firms' finances, but this highlights the ongoing struggle that many firms face in getting their clients to pay on time.

Net assets per member
Unsurprisingly, the top ten firms show the highest average net assets per member, at just below £700,000, a slight fall compared to the previous year. This is in contrast to firms ranked 51 to 100, which on average show a slight increase, but still only to just above £200,000 per member. Net assets per member for firms in the 11 to 50 group are around £350,000 to £450,000 per member.
These figures are based on our analysis of the latest published LLP financial statements submitted by the UK's top 100 law firms.
The content of this article is intended to provide a general guide to the subject matter. Specialist advice should be sought about your specific circumstances.

