To read this Report in full please click here.
1. EXECUTIVE SUMMARY
Every year in the life of an accountancy firm's technical department sees a new excitement or, as it is more colloquially known, that wretched question. 2010 has been true to form. That question has been "is a third balance sheet and related notes really required in the following situation?". The International Accounting Standards Board had compromised (sorry, responded to respondents' concern over unnecessarily increased disclosures or over impracticality, excess and cost) by watering down its original 2006 proposal of three balance sheets for all. Now, a third balance sheet is needed only when there have been retrospective applications or restatement, or reclassification. This has given rise to many questions.
After all that angst, 9% of corporates, in this year's survey of financial statements, have given three balance sheets. That includes those who now use the term "statement of financial position". Are four words better than two? Are all those numbers in the three balance sheets, with an average of 31 lines per balance sheet, together with related notes, better than the two which have been sufficient for many decades? Is it better to drown in the sea of numbers or to take action in the fight for clear communication?
The purpose of this survey is not to debate the merits of particular disclosures. It is to report on current reporting practices among corporates and investment trusts. Section 16 reports on the latter group. For listed companies other than investment trusts, key findings include:
- 45% of parent company financial statements continue to use UK GAAP some five years after their consolidated financial statements have moved to use IFRS. These will, under the ASB's current proposals, have to convert to IFRS from 2013/14;
- accounting policies are on average six pages long and subsume 13% (2009: 12%) of the financial statements. Many of these policies merely repeat the requirements of the accounting standards;
- almost all (95%) companies disclose the list of accounting standards and interpretations in issue but not yet effective. Only in 13% of cases are these deemed to have a potentially material impact;
- while the notes on critical judgments include many common items, such as on goodwill and pensions, it is encouraging that company-specific items which could not be easily categorised were the most common category; and
- in the year in which the new accounting standard, IFRS 8, on operating segments had to be adopted, the impact was an increase in the average number of reporting segments from three in 2009 to four this year.
Some of the above, and other findings in the survey, provide clues of areas where disclosure requirements could be eased. For example, 34% of corporates reported that they had spotted the new IFRS 8 requirement to report reliance on major customers. But a half of these reported that they had none. Did they do so simply to pre-empt a question from the Financial Reporting Review Panel?
There is much talk on the disclosure burden imposed by accounting requirements. On the horizon are a suite of new standards on topics such as revenue, leasing, financial instruments, consolidation and insurance contracts. Now is a good time for action so that all are not drowned by numbers when the next wave of new standards hits.
2. SURVEY OBJECTIVES
The main objectives of the survey were to discover:
- the level of variety in presentation of the primary statements in listed companies' financial statements;
- which critical judgements and key estimations directors consider to be the most significant when preparing their financial statements;
- how compliance with disclosure requirements and the accounting policy choices made under IFRSs varied;
- how many companies chose to adopt IFRSs for the parent only financial statements and how audit opinions varied; and
- how the results compared with similar surveys performed in previous years.
The annual reports of 130 listed companies were surveyed to determine current practice. The sample of companies is the same as that used for Deloitte's recent publication which surveyed narrative reporting. Consistent with the approach adopted in Deloitte's 2009 surveys, the companies were split into two groups being 30 investment trusts and 100 other companies. Investment trusts are those companies classified by the London Stock Exchange as non-equity or equity investment instruments (this excludes real estate investment trusts). They have been treated as a separate population due to their specialised nature and the particular needs of their investors.
The sample is, as far as possible, consistent with that used in last year's survey. As a result of takeovers and mergers over the last twelve months, the sample could not be identical. Replacements and additional reports were selected evenly and at random from three categories being those within the top 350 companies by market capitalisation at 30 June 2010, those in the smallest 350 by market capitalisation, and those that fall in between those categories (the 'middle' group). Furthermore, because of clustering within the top 350 companies' category, five companies were replaced with the new ones chosen at random. The comparatives for 2009 were then reworked to use the same companies in both years in that category.
The annual reports used were those most recently available and published in the period from 1 August 2009 to 31 July 2010.
As noted above the findings for investment trusts are analysed separately within this publication. Sections 3 to 15 summarise the results for the 100 companies excluding investment trusts and section 16 reviews the 30 investment trusts.
This publication is structured in a similar way to that of most financial statements, starting with analysis of the primary statements, followed by the accounting policies and then the notes.
3. OVERVIEW OF THE FINANCIAL STATEMENTS1
|
Pages 12 and 13 of the 2010 Deloitte survey of narrative reporting in annual reports, "Swimming in words", discusses in detail the length of the annual report. This publication covers the overall length and then considers the financial statements therein.
Figure 1 below sets out the results in total by category for the six most recent survey periods.
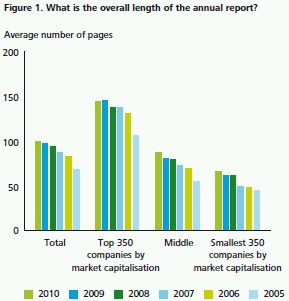
As a percentage of the annual report as a whole, the financial statements varied from 21% to 71%. The top 350 companies have continued to reduce the proportion of the annual report dedicated to the financial statements, with the financial statements representing an average of 43% (2009: 44%) of the annual report compared to an average of 49% (2009: 49%) across the sample. In comparison, the smallest 350 companies had an average of 54% (2009: 54%) of the annual report taken up by financial statements. While the proportions have remained constant, the overall length has increased. This is as expected as the changes in the accounting standards in the current period have affected the type of information disclosed, with, for example, the new accounting standard, IFRS 8 on operating segments, increasing disclosures for some companies.
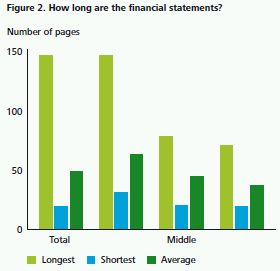
As illustrated in Figure 2, there is a clear relationship between the length of the financial statements and the size of the business. This is expected, as companies in the top 350 are generally more complex and are subject to additional disclosures usually relating to financial instruments and pensions. The range between the longest and shortest financial statements is noticably larger in the top 350, the longer financial statements largely representing those entities in the banking sector where the financial statement disclosures are largely made up of those relating to financial instruments. The gap between the longest and shortest financial statements has continued to grow in the year, ranging from 18 to 137 in the year (2009: 16 to 127).
Speed of Reporting
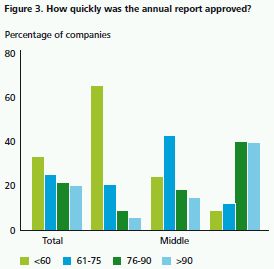
57% of companies reported within 75 days (2009: 57%) with only 21% of companies reporting after 90 days (2009: 21%).
The top 350 companies were the quickest reporters, with 85% reporting within 75 days (2009: 85%), 9% between 76 and 90 days (2009: 9%) and 6% reporting after 90 days (2009 6%). The middle group had slightly deteriorated in the year with 15% (2009: 12%) reporting after 90 days. The smallest companies remain the slowest reporters with 39% reporting after 90 days, albeit an improvement on 2009 where 52% reported in that timeframe.
The Disclosure and Transparency Rules (DTR) require that the annual report, which includes the audited financial statements, a management report and the responsibility statement, is published within four months of the end of the financial year. The potential impact of not complying with this rule is the suspension of shares. Overall, compliance with this requirement was excellent with all companies meeting the deadline.
Reporting Frameworks and Auditors' Reports
In the sample all companies had transitioned to IFRS in previous periods.
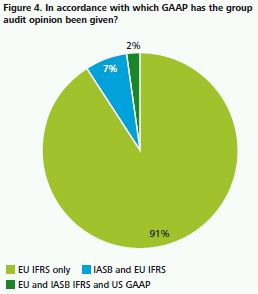
91 companies had an audit opinion under accounting policies which were in accordance with IFRS as adopted by the European Union (EU). Seven companies had an opinion under IFRS as issued by the IASB in addition to those standards adopted by the EU. Two companies had an opinion under IFRSs as issued by the IASB, those adopted by the EU and a separate opinion in relation to US GAAP.
The number of groups reporting the results of their parent company under IFRS was 55%, the remaining 45% of companies reporting under UK GAAP. It has been rare to see a change in the accounting framework applied to parent companies.
All companies in the current year had subsidiaries and were required to prepare consolidated and parent only accounts.
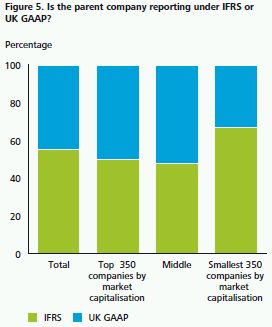
The UK Accounting Standards Board (ASB) is consulting its constituents on the future of UK GAAP. The ASB believes that only one accounting framework is needed in the UK and it should be based on IFRS. The ASB has issued an exposure draft seeking views on its proposal to replace current UK GAAP by a new tiered approach. Under this approach, the listed parent company would have to use full IFRS in its solus financial statements.
63% (2009: 61%) of companies provided one auditors' report which covered all opinions given, whether applicable to the consolidated financial statements or the parent company financial statements. 34% (2009: 35%) of companies had two auditors' reports, being one for the consolidated financial statements and a separate opinion for the company financial statements.
Two (2009: two) companies had three auditors' reports. British Telecommunications plc and Vodafone plc contained three separate auditors' reports, being one for consolidated financial statements covering both IFRS opinions (EU endorsed IFRS and as issued by the IASB) and one for the company. British Telecommunications plc also had a separate report for consolidated financial statements under US GAAP and Vodafone Group plc had a separate report on internal controls.
One (2009: one) company, Mondi Group plc, presented four audit reports. This company is listed in two different countries and presents separate audit reports for both the group and the parent company – covering opinions on compliance with IFRS applicable to South Africa, IFRS as adopted by the EU and IFRS as issued by the IASB and opinions to the members of South African limited company and to the members of the British plc.

95% of audit opinions were unmodified, an improvement from 91% last year. Of the sample, five had emphasis of matter paragraphs, four that related to uncertainty over going concern, the remaining relating to regulatory uncertainties. One of those reports was also qualified due to a limitation in audit scope.
Going Concern
In October 2009 the FRC published Going concern and Liquidity Risk: Guidance for Directors of UK Companies 2009 (the 2009 Guidance). This guidance is applicable for periods ending on or after 31 December 2009.
The format and style of the 2009 Guidance is significantly different to the 1994 Guidance. The revised guidance follows the same practical approach to making a going concern assessment. However the content of the revised guidance has been redrafted to focus on three key principles:
- Assessing Going Concern – Directors should make and document a rigourous assessment of whether the company is a going concern
- Review Period – Directors should consider all available information about the future when concluding whether the company is a going concern at the date they approve the financial statements, covering a period of no less than 12 months from date of accounts approval
- Disclosures – Directors should make balanced, proportionate and clear disclosures about going concern for the financial statements to give a true and fair view, making specific disclosures on whether the period considered is less than twelve months from the date of approval of the financial statements
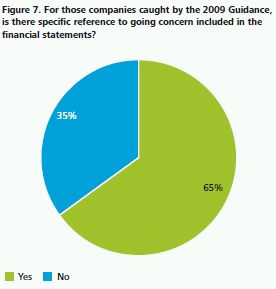
50% (2009: 32%) of companies surveyed included a statement in the financial statements regarding the directors' assessment of going concern despite 77% having periods ending on or after 31 December 2009. 65% of relevant companies caught by the FRC guidance included a reference to going concern in their financial statements. For those entities that did not include any specific reference to going concern in the financial statements, an assessment was made in the front half.
4. INCOME STATEMENT – RESULTS FROM OPERATING ACTIVITIES2
|
Contents of the Income Statement
IAS 1 requires, inter alia, separate disclosure on the face of the income statement of revenue, finance costs, tax expense and profit or loss.
99% (2009: 99%) of companies complied with the presentation requirements of IAS 1. The non-compliant company had disclosed its finance costs net of finance income. This presentation is popular with companies reporting under UK GAAP but has been rejected by IFRIC (now renamed the IFRS Interpretations Committee) as an acceptable option under IFRS.
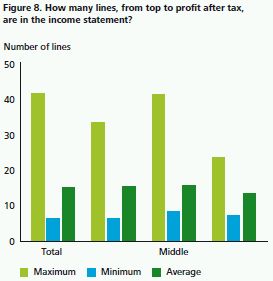
The length of the income statement, measured in number of lines from top to profit after tax, ranged from seven to 42 lines (2009: eight to 34 lines). The average number of lines was 16, the same as last year. 11-15 lines was the most popular range of lines presented on the income statement, adopted by 48 companies (2009: 54 companies). Figure 8 illustrates how this varied according to size of company.
There is no specific requirement regarding the classification of operating expenditure on the face of the income statement. IAS 1 recognises that showing expenses by either function or nature has benefits for different companies. Figure 9 shows how operating expenses are presented on the face of the income statement.
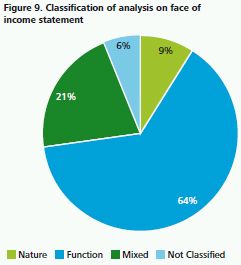
64% of companies sampled presented their expenses by function, for example as part of cost of sales or administrative costs. Where costs are presented by function there is a further requirement within IAS 1 to disclose additional information on the nature of the expenses including depreciation and amortisation expense and employee benefits expense. This requirement was met by companies.
9% of companies presented their expenses by nature. 21% of companies presented a mixture of presentation by function and by nature, and 6% did not classify their expenses on the face of the income statement.
There is considerable variety in the presentation of the income statements as companies present their results in a manner that is most appropriate to their business. However, this variety reduces the users' ability to compare easily one company to another.
Additional Non-GAAP Measures
In the current year the number of companies that went beyond the IAS 1 requirements and presented additional non-GAAP performance measures on the face of the income statement has reduced to 58% (2009: 69%). One reason for the reduction in the presentation of non-GAAP measures is due to a higher proportion of companies incurring exceptional items last year (such as restructuring, redundancies or impairments).
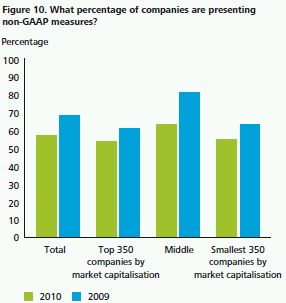
This use of additional measures is permitted under IAS 1 which encourages such items to be presented when this is relevant to an understanding of a company's financial performance. In the survey, of the companies that presented additional non-GAAP information, 16% of companies did not define their additional non-GAAP measures. This is an improvement from the previous year in which 23% of relevant companies did not provide a definition. The improvement from last year may be attributable to the reduction in the number of non-GAAP items being presented.
The items most commonly excluded in non-GAAP performance measures are detailed in Figure 11 below.
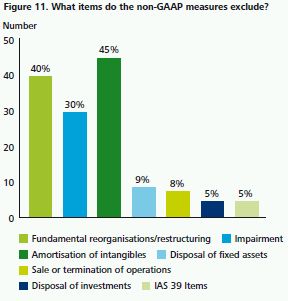
The most commonly used non-GAAP measures (69% of the relevant companies) excluded the costs of fundamental reorganisations. Impairment charges were excluded by 52% of companies with non-GAAP measures, an increase on last year's 40%.
Other common exclusions were the effects of the amortisation of intangibles, disposal of investments and fixed assets, sale or termination of operations, and items relating to IAS 39 Financial instruments: Recognition and measurement.
52% of companies giving additional performance measures referred to the highlighted items as 'exceptional', a term not used in IFRSs but obviously familiar to those who used to report under UK GAAP. Less common were the terms 'non-recurring'(3%) and 'underlying' (2%).
Additional performance measures are presented on the face of the income statement in a variety of ways, as Figure 12 below illustrates.
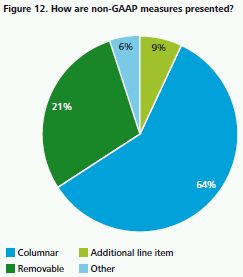
59% of relevant companies took a columnar approach to presenting their non-GAAP measures. There was:
- a complete income statement, from revenue to profit after tax, which excluded the non-GAAP measures;
- a middle column containing the non-GAAP items; and
- a column showing the full results including the non- GAAP items.
This method is illustrated in the Annual Report for BT Group plc below.

The second most popular option was the removable box approach, used by 29% of relevant companies. Under this approach the non-GAAP items were included in the income statement but further analysis, typically of operating profit, was presented to highlight these 'exceptional items'. This is demonstrated in the Annual Report of Oxford Instruments Group PLC below.

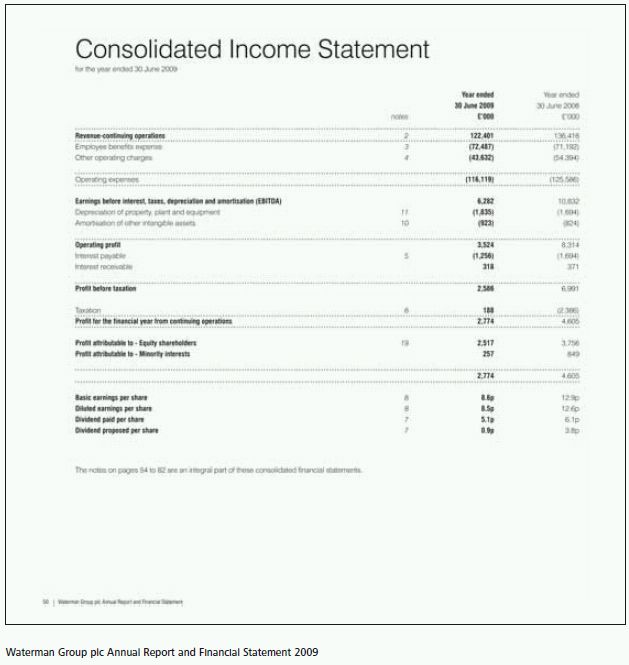
7% of relevant companies in the sample included additional line items in their income statement. This approach excluded the non-GAAP measure from the main body of the expense and often included a sub-total such as "Earnings before interest, taxes, depreciation and amortisation (EBITDA)", such that the non-GAAP measure was integral to the income statement. This is demonstrated in the Annual Report of Waterman Group PLC below.
To read this Report in full please click here.
Footnotes
1. This section analyses the findings for all companies other than investment trusts
2. This section analyses the findings for all companies other than investment trusts
The content of this article is intended to provide a general guide to the subject matter. Specialist advice should be sought about your specific circumstances.
