International filing activity in Japan: a 10 year overview
As a country featuring companies comprising both size and innovation, Japan has long been among the top 5 jurisdictions where companies have chosen to protect their intellectual property. It boasts impressive numbers of annual filings of patents, trademarks, designs and utility models, and relatively fast examination procedures.
Given its importance for IP, it is interesting to cast some light on a specific subcategory: foreign filings into Japan.
This article will provide you with an overview of the patent filings by international companies into the country, showing their numbers and countries of origin and revealing trends along the way.
General country-level trends
Japan is a jurisdiction that sees just under 300,000 total patents filed per year. While this number has been decreasing over the long term, foreign companies have steadily increased their filing activity in Japan: Over the 10 year period from 2012 to 2021, filing by international applicants increased by nearly 20%, reaching over 66,000 applications in 2021.
Japan's international filings mainly come from 10 jurisdictions, that have remained steady over the decade. The table below shows these and displays the percentage by which filing has changed from 2012 to 2021. The numbers include both PCT and Paris route filing1.
| Name | Total filings 2021 | % change compared to 2012 |
| United States of America | 24,999 | 9% |
| China | 9,369 | 363% |
| Germany | 5,965 | -13% |
| South Korea | 5,936 | 4% |
| Switzerland | 3,022 | 33% |
| France | 2,508 | -33% |
| United Kingdom | 2,179 | 32% |
| Netherlands | 1,847 | -7% |
| Taiwan | 1,563 | 14% |
| Sweden | 1,206 | 3% |
| Others | 8,154 | 34% |
While this table is somewhat lacking in detail, it does display several important trends:
- Chinese companies have dramatically increased their filing in Japan
- The United States is by far the largest filer, and has been during this decade
- There is a split among European countries: those that file clearly less in Japan like France, Germany and the Netherlands, and those that have increased their activity like Switzerland, the UK and Sweden.
- Filing from countries other than these 10 has seen significant increases too.
Detailed analysis of country-level tendencies
We can examine these trends in more detail by looking at the data for each individual year and for each individual country.
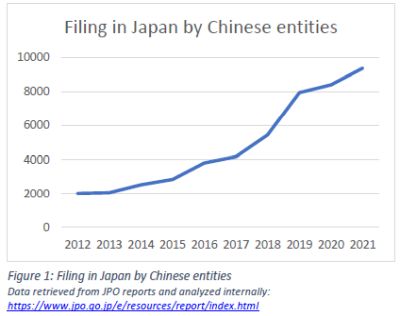
The following graph of filing by Chinese entities is particularly instructive in illustrating the first trend.
It shows that Chinese filing in Japan took off from 2014 and has seen strong growth since then. Particularly from 2017 to 2018 and from 2018 to 2019, filings grew by the 1000s. In that last year, 46% more patents were filed compared to 2018. During the entire period, total Chinese filing into Japan has not decreased once.
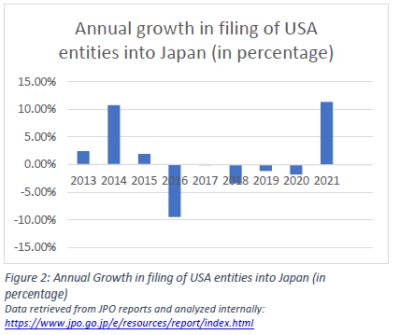
Diving deeper into the 2nd trend, we see that that although US filing into Japan increased over 10% during this period. It did not grow consistently in each year, as the graph below reveals. We can see how much the filing increased or decreased compared to each previous year. Looking closely, we find modest growth in 2013 (compared to 2012), and again from 2014-2015. Indeed, we also see double digit growth from 2013- 2014 and from 2020 - 2021.
At the same time, we also observe one year without growth (2016-2017) and 4 years with decrease in filing activity.
What is interesting about 2021 is that it marked a strong increase in filing activity after 5 years of stagnation and slow decline. Overall, it is clear that US companies and organizations will continue to be the top filers in Japan, though sustained long-term growth of filing is perhaps less likely.
With regards to the 3rd trend, we can distinguish 2 groups among European countries. Those that increased their filing activity, such as Switzerland, the U.K and Sweden, and those that reduced it such as France, Germany and the Netherlands.
Among the first group of countries, Switzerland and the U.K. saw strong growth of 33% and 32% respectively over the past 10 year period.
Looking at the year-on-year trend we found that total U.K. filing only decreased from 2014-2015, otherwise steadily showing upwards movement. After China, the U.K. is most consistent in filing more each year.
Filing by Swiss companies is somewhat more uneven, as filing numbers experienced negative growth 4 times, though 2 of these were less than a 1% decrease. Worth noting is also the increase of 16.14% from 2020 to 2021, the strongest for Swiss companies in a decade.
Finally, Swedish filing did increase during the decade but only by 3%, and given Sweden's relatively modest total yearly filing, this amounts to some 36 cases. Over the 10 year period, Swedish filing has been more fluctuating with 4 instances of annual decrease, sometimes in the double digits, while also seeing double digit growth from 2016 to 2019.
France, Germany and the Netherlands form the second group. France's change has been the strongest, marking a 33% reduction, and indeed a consistent yearly reduction of filing in 7 out of 9 years. For Germany, relative decline is also clear (over 6 years) but the percentage by which filing is reduced is lower than that for France. The Netherlands too has also seen steady reduction in filing, in 6 out of 9 years, in particular since 2018.
Finally, it is worth paying close attention to the final group, the "other countries". As it includes a very large and diverse group of jurisdictions, it is hard to be specific. Nevertheless, it has grown 34% in 10 years and year-on-year filing was only negative in 2 years out of 9. Fundamentally this means that more inventions from countries other than the top 10 have been finding their way to Japan.
Overall yearly growth patterns
In addition to patterns of growth and decline among countries, it also worth analysing yearly growth trends among all applicants together.
As we know, annual foreign filing increased by nearly 20%: from 55783 cases filed in 2012 to 66748 in 2021. As we are also aware of the remarkable growth of Chinese applications in Japan, we should not be surprised that Chinese filings account for 67% of this increase. Yet we can look more broadly to see a pattern broadly shared across borders.
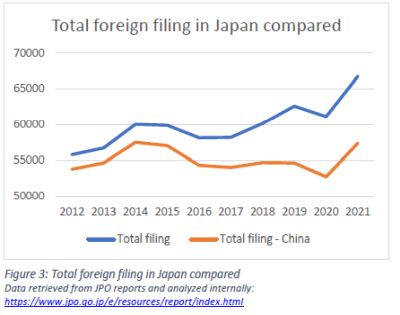
The graph on the left hand side shows this most clearly. Zooming in to clearly see the yearly changes, total foreign filing in Japan is plotted against that total foreign filing minus Chinese filing. Overall, we notice an increase in filing from 2012 to 2014, and a period of some decline and relative stagnation afterwards. Particularly by excluding cases from China we notice that the overall number did not change that much for a number of years.
The other pattern that is visible and which is shared across jurisdictions is the decline (or less strong growth) in filing from 2019 to 2020, followed by a strong rebound from 2020 to 2021.
The conclusion that the corona-virus pandemic has initially made companies hesitant to apply for patents appears clear. Among the 10 jurisdictions + the rest of the world, 8 of them filed less in 2020 than they did in 2019, while those that did file more mainly saw modest growth.
On a positive note, the rebound from 2020 to 2021 has been strong: in 7 out of 8 jurisdictions that had previously seen their numbers decline, filing activity rose again.
And for the 3 jurisdictions with positive growth during the pandemic, 2 of them filed even more in 2021.In fact, the United States, Germany, Switzerland, France and the U.K. all saw the highest percentage increase in a decade. It would not seem strange to speculate that some of the filing that did not happen in 2020, was eventually done in 2021.
Overall, Japan has maintained and even somewhat strengthened its position as a destination for global patent protection over the past decade. As filing by domestic Japanese companies has been on a downward trend for even longer, the share of foreign-owned IP among the total yearly applications is set to increase further.
Footnote
1. Data was retrieved from the JPO's annual report 2013, and 2014 and the JPO's status report 2015 to 2022. Subsequently the data was aggregated and analysed by Sonoda&Kobayashi. The reports can be found here: https://www.jpo.go.jp/e/resources/report/index.html
The content of this article is intended to provide a general guide to the subject matter. Specialist advice should be sought about your specific circumstances.

