
This survey is a special interim report to highlight changes in the Silicon Valley venture capital environment through July 2020 in light of the COVID-19 pandemic.
Please note that when providing data on a monthly basis, and especially when analyzing trends among industries or series on a monthly basis, we are working with smaller numbers than in our quarterly report and accordingly the possibility of statistical anomalies increases.
Key Findings
The venture environment is looking solid. Deal volume continued to be strong in July, with a notable increase in the percentage of early-stage financings. Valuation metrics are improving, although still lagging pre-pandemic levels.
Financing volume strong.
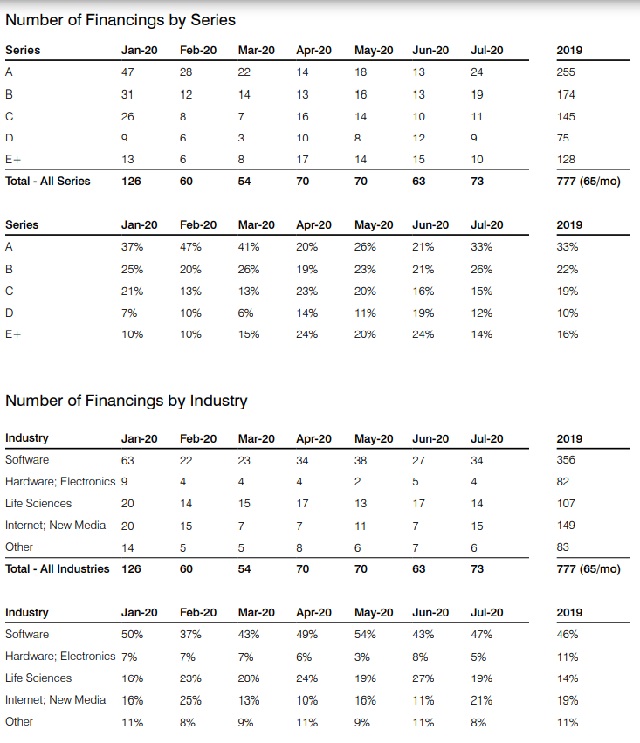
- The number of Silicon Valley venture financings increased to 73 in July from 63 in June, and surpassed the 2019 monthly average of 65.
- Earlier stage financings accounted for 59% of July financings, the highest percentage since March and slightly higher than the 55% monthly average in 2019. The percentage of early-stage financings had been low in April, May and June, perhaps due to venture capitalists focusing on securing capital for their existing, later stage investments, but the early-stage segment appears to have recovered.
Valuations improving, although still lagging pre-pandemic results.
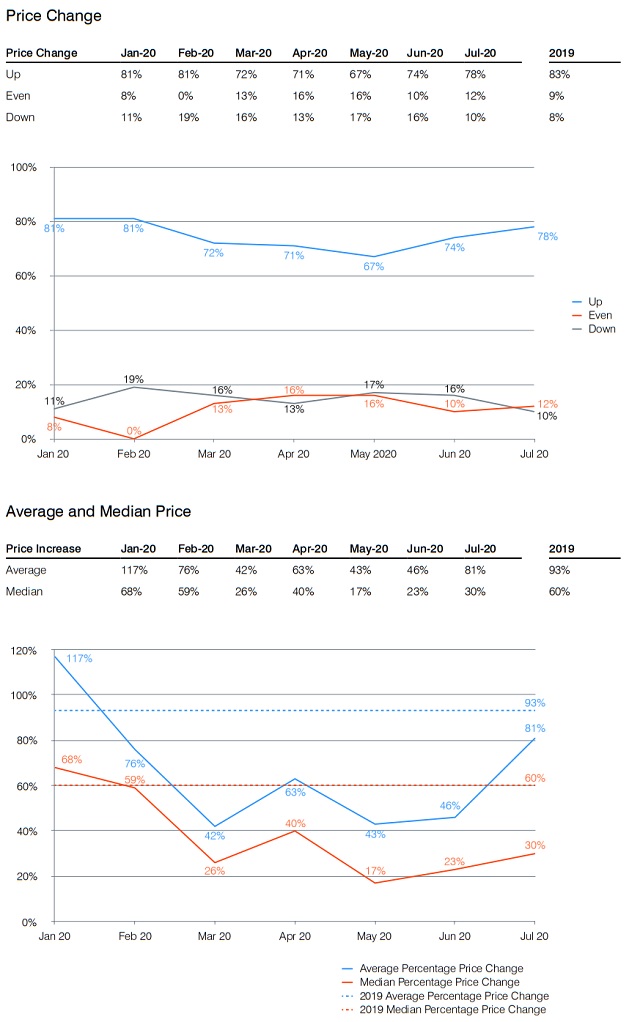
- The percentage of up-rounds increased slightly from 74% in June to 78% in July. July had the highest percentage of up-rounds since February but continued to trail the 83% average up-round percentage in 2019.
- The average share price change of
financings increased significantly, from 46% in June to 81% in
July. This was the largest monthly price increase since January.
That said, July results trailed the 2019 average monthly increase
of 93%.
July results were helped significantly by three companies that each had financings with over 400% increases compared to their prior round. As the companies were in the remote working and distance learning fields, they likely benefited from the increased demand in these areas due to the pandemic.
- The median per share price change of July financings also improved over June results, increasing modestly from 23% to 30%. However, July's results significantly trailed 2019's monthly median increase of 60%.
Investing was generally solid across industries, with life sciences outperforming compared to its historical performance, but hardware deal volume continued at a low level.
- All major industries except hardware had more deals in July than their 2019 monthly average. The life sciences industry has averaged 15 financings a month since January, compared to its average of nine financings a month in 2019.
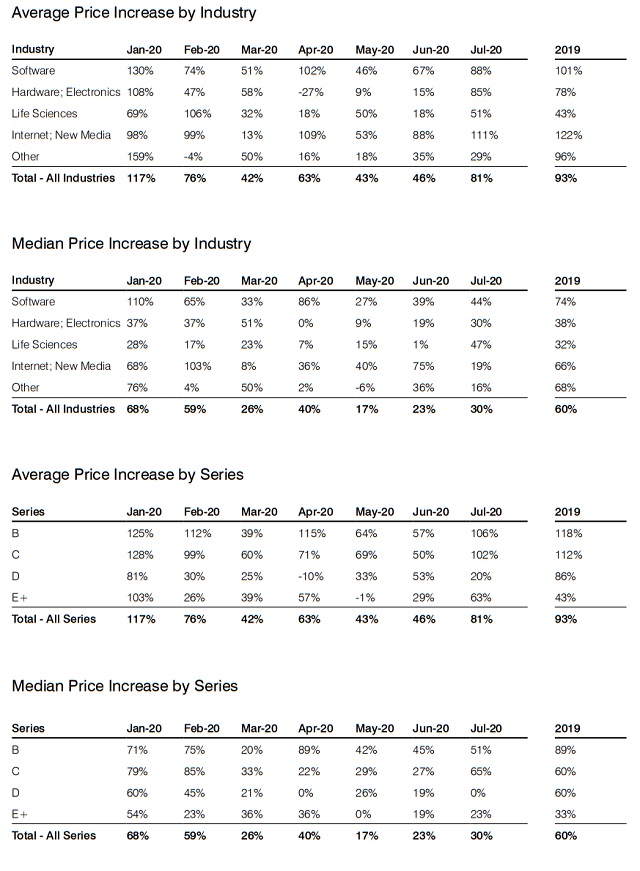
- All major industries had solid average price increases. Median price increases lagged 2019 results for all industries other than life sciences.
Detailed Results
The following charts focus on the results discussed above. More detailed charts will be provided in our Silicon Valley Venture Capital Survey for the entire third quarter of 2020, which will be released in early November.
About our Survey
The Fenwick & West Venture Capital Survey has been published quarterly since the first quarter of 2002. Its goal is to provide information to the global entrepreneurial and venture community on the terms of venture financings in Silicon Valley.
The survey is available to all, without charge, by signing up at www.fenwick.com/vcsurvey/sign-up. We are pleased to be a source of information to entrepreneurs, investors, educators, students, journalists and government officials.
Our analysis of Silicon Valley financings is based on independent data collection performed by our lawyers and paralegals, and is not skewed toward or overly representative of financings in which our firm is involved. We believe that this approach, compared to only reporting on deals handled by a specific firm, provides a more statistically valid and larger dataset.
This survey consists of priced equity financings of companies headquartered in Silicon Valley that raised at least $1 million from venture capitalists or other professional investors during the applicable time period. Subsequent closings of financings are only treated as new financings if they occurred at least six months after the initial closing. In identifying financing rounds, we label the first professional round as Series A, the second professional round as Series B, etc., regardless of the actual name used by the company, to increase comparability across companies. For purposes of determining whether a company is based in "Silicon Valley" we use the area code of the corporate headquarters. The area codes included are 650, 408, 415, 510, 925, 916, 707, 831 and 209.
The content of this article is intended to provide a general guide to the subject matter. Specialist advice should be sought about your specific circumstances.