
Over the past few years, the rise of multi-asset strategies, especially DGFs, has been a significant trend in the UK institutional market. At MJ Hudson Allenbridge, we have seen some interest among our institutional clients, evidenced by some manager searches in the space over the last two years. Institutional adoption of the strategy has become widespread, albeit the recent disappointing returns have made investors sceptical; we have seen an increasing number of investment managers offering these products in the last few years. The below is an extract of The MJ Hudson Allenbridge Multi-Asset Funds Market Review where we examine the fees and the effect of MiFID II on the multi-asset fund industry.
Fees
Our survey indicates that a handful of multi-asset managers responded by lowering their own management fee to align with the charge cap1. In some cases, fees dropped lower than necessary in anticipation of any potential further charge cap reductions.
Chart 1: Annual Management Fee by fund AUM
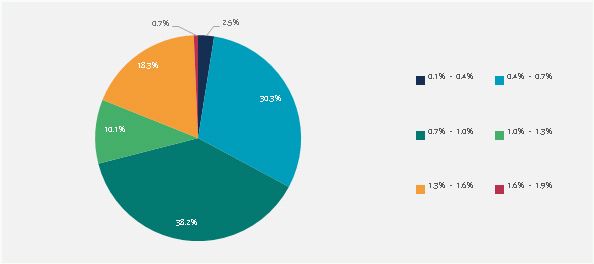
Source: MJ Hudson Allenbridge
Our survey has found that fees are lower than the charge cap as the median management fee across the 91 funds we are tracking are 55 bps and the majority of funds charge a management fee of less than 70 bps. Despite this significant shift, there are still a considerable amount of assets invested in multi-asset funds that charge more than 70bps. Our survey reports that 38.2% of assets were still invested in multi-asset funds that charge an annual management fee between 70-100 bps. We expect assets to slowly shift towards funds that offer more cost effective solutions to investors. Performance fees are rare in the multi-asset space, although there are a handful of managers who continue to charge performance fees.
In a market where regulation, in some cases, but mainly competition for investor assets are pushing down fees, the expansion of systematic2 and passive funds in the multi-asset market provides a range of different strategies within a cost-effective and transparent framework, which can be an appealing addition for investors.
Chart 2: Distribution of Ongoing Charges
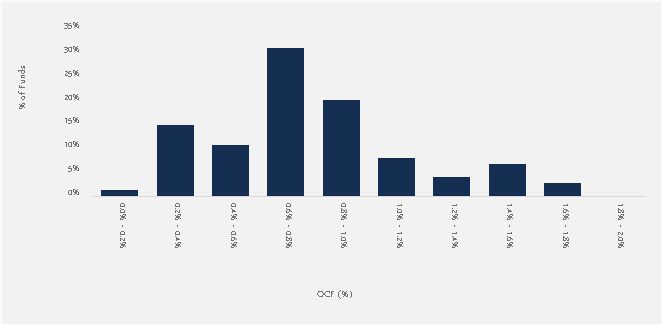
Source: MJ Hudson Allenbridge
Chart 2 shows the distribution of ongoing charges figures ("OCF"). The majority of multi-asset funds (78%) have ongoing charges of less than 1.0% and about half of the managers charge an OCF ranging between 0.6%-1.0% per annum. We can expect the distribution to become even more positively skewed as fees become ever more competitive with greater transparency.
Chart 3: OCF by different multi-asset type

Source: MJ Hudson Allenbridge
Multi-asset funds access all markets and asset classes and therefore a cost comparison with other strategies will always be difficult. We believe that the fees charged should be proportionate to the investment returns investors are receiving. With increasing transparency, managers are increasingly being scrutinised by multi-asset allocators on fees and costs. Managers must ensure fees are justified and are appropriately remunerated for delivering alpha and not simply for delivering market beta.
As illustrated in Chart 3, Passive/Strategic Allocation (Balanced) Funds have on average the lowest ongoing charges. Having a static allocation requires less active management from the manager, which should translate to lower overall costs being passed on to investors. The other strategies charge higher ongoing fees on the basis of more complexity.
MiFID II
With the MiFID II legislation having come into force in January 2018, the asset managers who are MiFID firms and so subject to MiFID II, are no longer able to combine or "bundle" transaction costs with research costs but must separately pay for research rather than receiving it free from brokers and investment banks. In Chart 4, we asked managers about the impact of MiFID II on their combined costs (brokerage and research costs) given that this has forced asset managers to reassess the quantity of research they source from investment banks and/or brokers.
Chart 4: Multi-asset Managers' responses on how MIFID II will affect combined costs
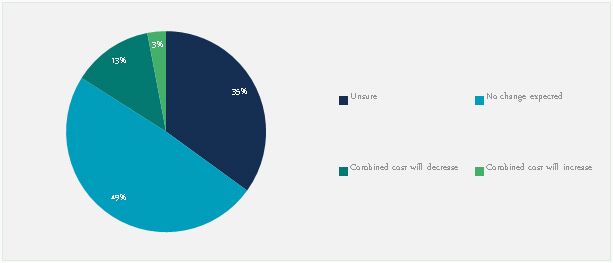
Source: MJ Hudson Allenbridge
Our survey found that with the introduction of MiFID II, most managers were unsure of, or expected not to see, any changes to their future combined costs. Only a handful of managers expected to see either a decrease or increase in combined costs.
Chart 5: multi-asset managers on how MIFID II will affect their usage of brokerage research
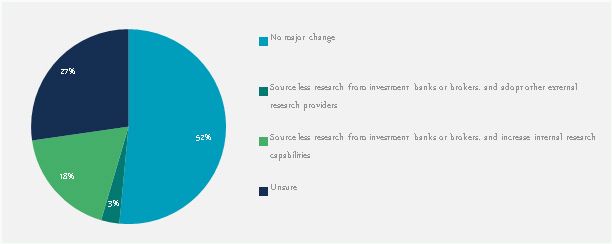
Source: MJ Hudson Allenbridge
Managers were also unsure of, or expected no change, to the brokerage research they would use. Some managers highlighted that they would decrease their reliance on brokerage research and in return would try to increase their own internal research capabilities.
Footnotes
1 In April 2015, the UK government introduced a 75 bps charge cap only for those auto enrolled in Defined Contribution (DC) schemes – to avoid high fees eroding pension pots.
2 MJ Hudson Allenbridge, "Systematic Factor Market Review Q4 2017", https://www.mjhudson.com/assets-systematic-strategies-doubled-last-three-years-according-mj-hudson-allenbridge-survey/
The content of this article is intended to provide a general guide to the subject matter. Specialist advice should be sought about your specific circumstances.

