
The D&O team offer a state of the market overview for Q2 2023 highlighting competition in the London market between insurers and claims trends.
Introduction
This update analyses our observations of the current market conditions for Directors' and Officers' insurance and the impact this has on board directors, non-executive directors and insurance buyers and is based on our observations of the market with our WTW clients and not a whole of market review. For ease of understanding, the percentages have been presented as rounded figures.
Overview
Competition between insurers in London and other regions has been strong in the latter part of 2022 and first half of 2023, which put pressure on the London D&O market to reduce rates. Perhaps also influenced by lower claims notifications and US Securities Class Actions, this has led to significant softening in rates in Q2 2023.
In Q2 2023, most of our clients saw decreases in their renewals: 83% of clients saw their primary layer renew with a decrease on last year's premium whilst 89% saw their excess layers renew with a decrease (further detail can be found in chart 7 in Appendix I).
Insurers have also continued to soften policy terms and are increasingly willing to underwrite business using WTW's proprietary wording (DARCstar), a new version of which has just been launched this year to incorporate the latest improvements.
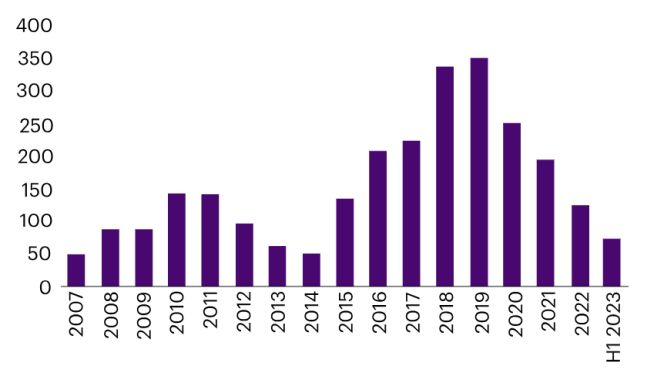
Following a period of significant decreases in the volume of claim and circumstance notifications between 2020 to 2022, notifications in H1 2023 have shown a marked increase compared with 2022 (see chart 3 below).
According to The Stanford Law School/Cornerstone's Securities Class Action Clearinghouse (http://securities.stanford.edu/charts.html), US Securities Class Actions for 2021 and 2022 were down from the historic highs of 2017-2020, with 2022 being even lower than 2021 (and the lowest level since 2014). If the securities claims made so far in 2023 are annualised, then it seems likely they will hit the levels of 2021 and be up slightly from 2022 (see chart 4 below).
Looking forward, we continue to see strong competition in the GB D&O insurance market.
Looking forward, we continue to see strong competition in the GB D&O insurance market, and we expect this trend to continue for the rest of 2023. Q3 has seen "any one claim" limits returning to the D&O market, with insurers offering this for some UK public and private companies, often for little or no additional premium.
DARCstar 2023 and DARCstar Private Equity 2023 have now been released, with CRIMEstar 2023 and a new Side A DIC facility due to launch imminently. We are also excited to be working on our next Directors' and Officers' Liability Survey which will be launching in October 2023.
Rate on Line Movement
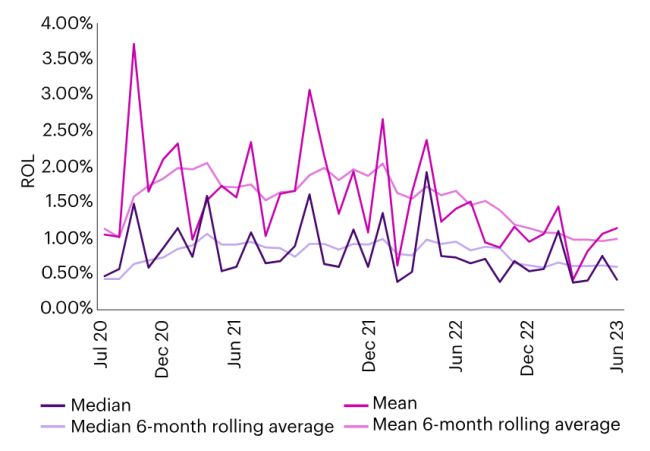
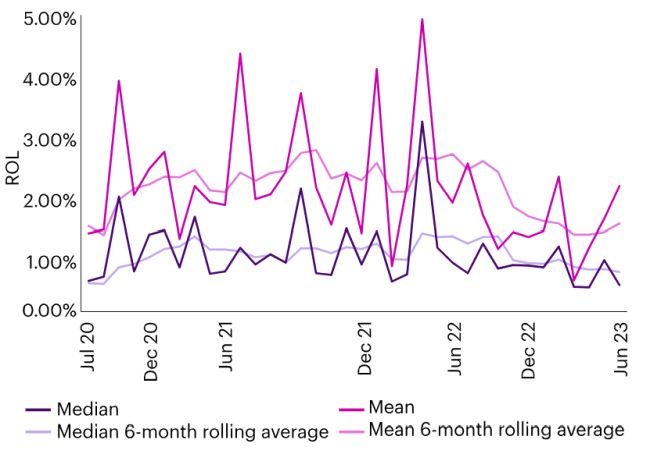
ROL analysis - ABC only Whole Tower
Chart
Source: Data from WTW FINEX FINMAR client placements, sourced as 11
August 2023, see Appendix II for further information
*You may notice that this graph looks different to our
Q1 update. Unfortunately, it is that the data that was included in
chart in our Q1 update was based on SME clients and not ABC
renewals. This has been corrected in this report.
- Primary layer rate on line figures resisted the softening of the market for much of 2022, but were overall on a downward trend in the last six months of the year and beginning of 2023. In H1 2023 median rates showed a decrease of 6%.
- Excess layer median rate on line figures have continued to see significant decreases in H1 2023.
- Whole tower median rates on line showed a decrease of 20%. However, the significant competition on excess layers is leading in some cases to discounts of over 50%. While the graph above shows an increase in the mean rates on line for Q2 2023 when compared to Q1 2023, year on year, the 2023 Q2 rates are still lower than the 2022 Q2 rates.
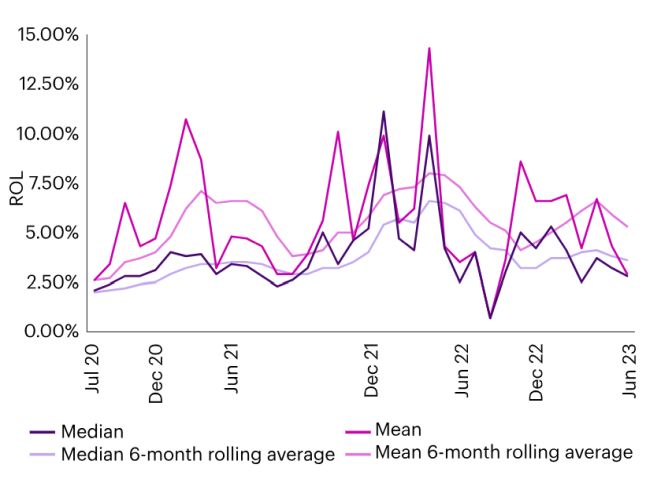
ROL analysis - SME whole tower
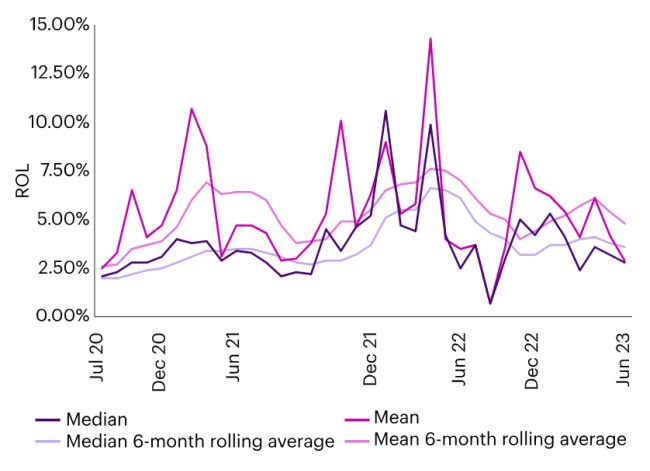
Chart 2
Source: Data from WTW FINEX FINMAR client placements, sourced as 11
August 2023, see Appendix II for further information
- SME whole tower: while there has been some fluctuation, overall, SME rates on line have decreased in H1 2023.
Notifications
After a period of significant decreases in notifications between 2020 to 2022, notifications in H1 2023 have showed a marked increase from the level in 2022 over the same period.
Commercial D&O - number of notifications
Commercial D&O - number of notifications
Chart 3
Source: WTW client notifications from GB placements only, between 1
January 2007 to 30 June 2023
US Securities Class Actions
Securities Class Actions filings through H1 2023 reflect year-over-year increases, annualised at 228 filings, which would be 10% higher than 2022. In contrast, for cases settled in H1 2023, the average settlement was USD 21 million, a 47% decrease over the 2022 inflation-adjusted average settlement of USD 39 million . Nevertheless, the median settlement was USD 16 million, a USD 3 million increase over 2022.
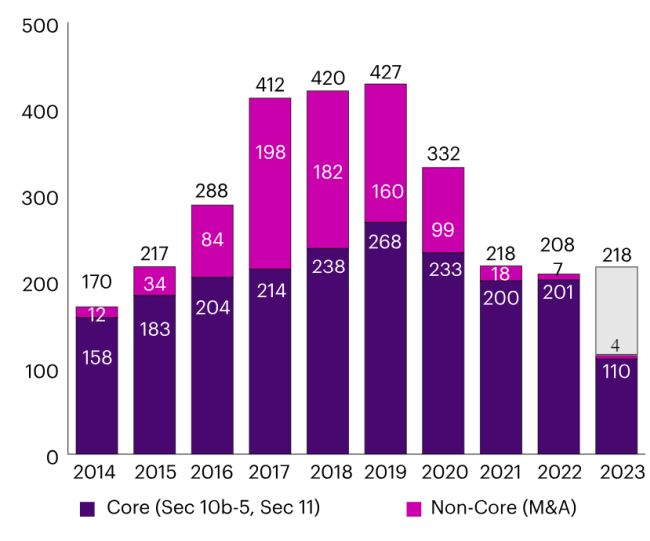
Federal Securities Class Action Filings 2014 to Q2 2023
Chart 4
Cornerstone Research, Securities Class Action Filings: 2022 Year in
Review. For 2023 filing figures year-to-date, see Cornerstone
Research, Securities Class Action Filings, 2023 Midyear Assessment.
Directors' and Officers' Liability Survey Report 2023
We have launched our report on our latest Directors' and Officers' Liability Survey in collaboration with international law firm, Clyde & Co LLP. With results from 40 countries in the world, this report provides invaluable insight into differing attitudes to risk across different regions, industries and company sizes.
For more information, see the articles to the right of this page which look at some of these risks in more detail.
Appendix I: Additional statistics
Rate on Line Analysis (ABC policies) Primary layers only
Chart 5
Data from WTW FINEX FINMAR client placements, sourced as 11 August
2023, see Appendix II for further information
SME Primary layers only
Chart 6
Data from WTW FINEX FINMAR client placements, sourced as 11 August
2023, see Appendix II for further information
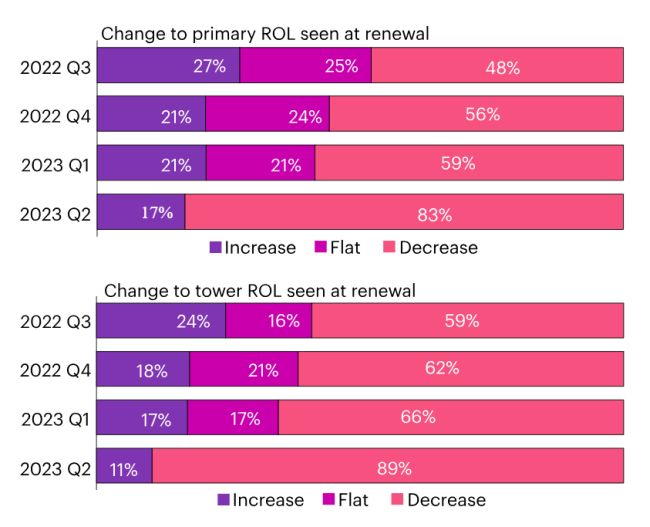
Whole Tower Rate on Line Analysis (ABC only) Changes seen at renewal
Chart 7
Data from WTW FINEX FINMAR client placements, sourced as 11 August
2023, see Appendix II for further information
Appendix II: Methodology for statistics
| Min | Max | Notes | |
|---|---|---|---|
| Rate on Line | 0.01% Rate on Line | No max | These graphs and stats are looking at the Rates on Line paid each month. Currently we only have a minimum value for Rate on Line, we could consider having a max Rate on Line. Rate on Line is calculated by dividing the premium by the limit of liability that is being purchased and expressing that as a percentage. This shows the proportional cost of the limit of liability being purchased by each client. |
| Rate on Line change | 0.01% Rate on Line | No max | We are comparing the Rate on Line paid last year to the Rate on Line paid this year for a given client at renewal. The outlier rule ensures an erroneously small Rate on Line isn't compared to a normal one resulting in a gigantic value (eg 1% / 0.0001% = 10,000 times increase). We could also add a maximum increase cap, eg no more than a 10 fold increase in Rate on Line. |
| Deductible change | X - 10 | X 50 | As above, here we are comparing the deductible last year to the deductible this year for a given client at renewal. Given the hugely different sizes of programs placed it is difficult to set a min or max for the actual deductible value so instead we have tied the rules to the change in deductible seen. A max increase of x50 was set as the previous x20 was seen as too small. This may want to be reviewed. |
| Limit | 0.01% Rate on Line | No max | Again, it is difficult to set a min for limit value due to the spread of clients we have. Given the Rate on Line value combines premium with limit it can be used to identify an error in one of the two. However, it could result in us excluding placements with correct limit values (and incorrect premiums). We could consider adding minimum and maximum limit values instead. |
| Limit change | X - 10 | X 50 | Similarly to deductible change, here we are comparing the limit bought last year to the limit bought this year for a given client at renewal. Given the challenge in settling min and max limit criteria the outlier rule looks at the calculated limit change and sets boundaries for that. A max increase of x50 was set as the previous x20 was seen as to small. This may want to be reviewed. |
Appendix II: Methodology for statistics
Figures in this report are based on WTW FINEX FINMAR client placements, sourced as 11 August 2023, and WTW client notifications from GB placements only, between 1 January 2007 to 30 June 2023. They will be updated periodically to reflect additional records. Graphs in this report show the moving average between 2020 and Q2 2023.
An ABC placement is one which includes cover for Side A (D&O non-indemnified loss), Side B (D&O indemnified loss) and Side C (Company Securities Claims).
The content of this article is intended to provide a general guide to the subject matter. Specialist advice should be sought about your specific circumstances.