
The United States Patent and Trademark Office (USPTO) recently posted the Patent Trial and Appeal Board (PTAB) statistics for December 2019 (first quarter of FY2020).1 Despite some inconsistences in the data, the statistics reveal some trends:
- Inter partes reviews (IPRs) remain the most common type of America Invents Act (AIA) trial.
- Life science/chemical patents and design patents are least likely to be challenged in an AIA trial.
- More than 50% of all AIA trials will be instituted (except for design patents).
- An AIA trial is more likely to settle post-institution.
- The majority of AIA trials are resolved before reaching a final written decision.
A more detailed discussion of these trends follows.
I. IPRs remain the most prevalent AIA trials, and the number of AIA trial petitions in FY2020 remains unchanged or appears to show a decrease compared with FY2019.
As of Dec. 31, 2019, 10,966 AIA trial petitions have been filed. The majority of AIA trials are IPRs (93%). Covered-business method reviews (CBMs)_ and post-grant reviews (PRGs) account for only 5% and 2%, respectively. In the first quarter of FY2020, 332 AIA trial petitions were filed (317 IPRs (95.4%), 5 CBMs (1.5%), and 10 PGRs (3%)). Extrapolating the first quarter numbers to all of FY2020, one would expect about 1290-1300 AIA trial petitions for the fiscal year, i.e. about a 10% decrease compared with FY2019. (1464 AIA trials were filed in FY2019, including1364 IPRs (95.2%), 22 CBMs (1.5%), and 48 PGRs (3.2%)).2 With CBMs sunsetting on Sept. 16, 2020, it will be interesting to see whether the number of CBM petitions increases in FY2020.
The number of IPR petitions almost doubled in December (144) compared with November (74). In fact, December 2019 is the second highest month for IPR petition filings in FY2019 and FY2020. The highest month for AIA petition filings was November 2018 (212 IPRs, 10 CBMs and 2 PGRs) 3, which was an anomaly as the PTAB changed the claim construction standard in November 2018.4 It remains to be seen if December 2019 is a new trend.
II. As before, electrical, computers, mechanical and business methods account for the vast majority of AIA trials.
AIA trials in electrical/computer (59%) and mechanical and business methods (28%) account for 87% of all AIA trials. Chemical (6%), bio/pharma (5%) and design (2%) account for the remainder. The FY2020 numbers are similar to the FY2019 numbers, which were as follows: 64% for electrical/computer; 23% for mechanical and business methods; 4% for chemical; 9% for bio/pharma; and 0.2% for design.
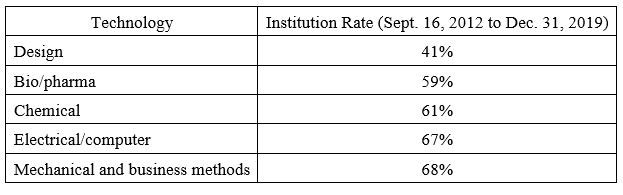
III. Institution rates continue to fall.
In the first year of AIA trials (FY2013), the PTAB instituted about 87% of AIA trials. In FY2014, the institution rate fell to 75%. For FY2015-FY2019, the institution rate remained between 60% and 68%, with a low of 60% in FY2018, 68% in FY2015, and 67% in FY2016. The institution rate in FY2020 thus far decreased to 55% compared with 63% for FY2019. Looking at all AIA trial petitions since implementation, AIA trials challenging design patents are least likely to be instituted.
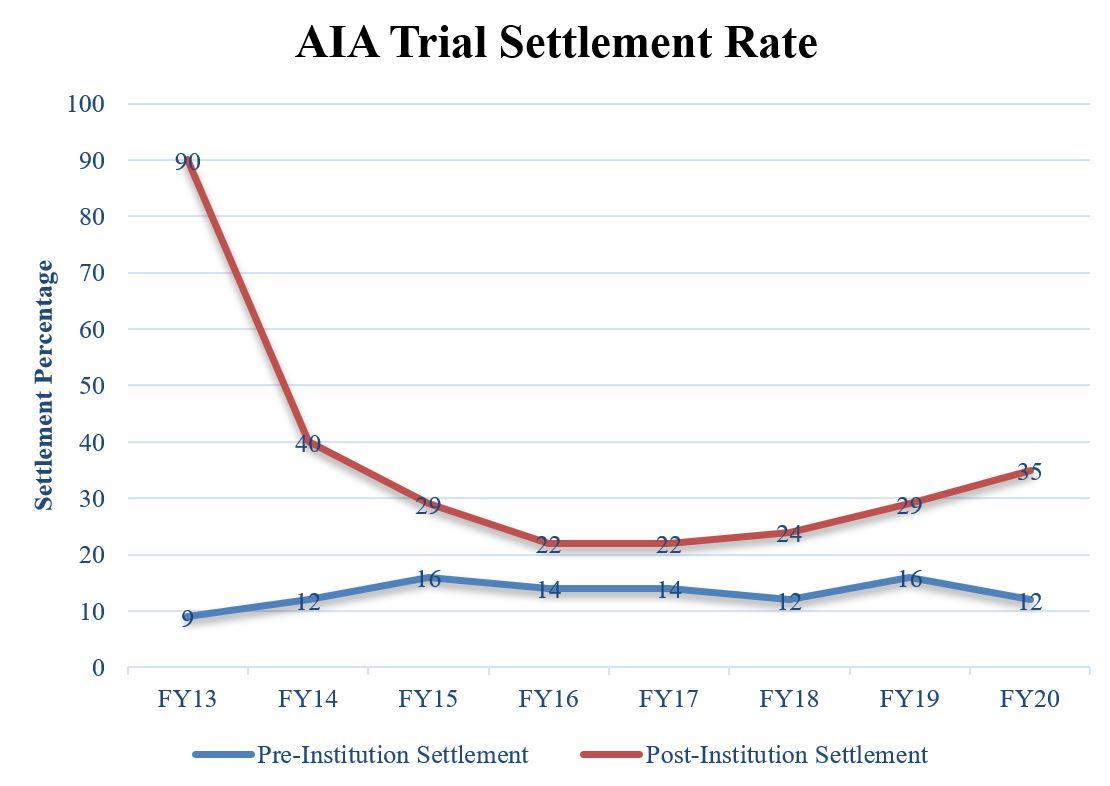
IV. While post-institution settlements are increasing, pre-institution settlements appear to decease.
When AIA trials were first instituted in FY2013, the majority of them resulted in settlement. Since then, settlements have decreased.
In FY2019, 16% of AIA trials settled pre-institution and 29% of AIA trials settled post-institution. Thus far in FY2020, 12% of AIA trials have settled pre-institution and 35% have settled post-institution. The total settlement rate for AIA trials in FY2020 appears to be about the same as that of FY2019. The chart below shows the settlement rates for all AIA trials (FY2013 to FY2020).
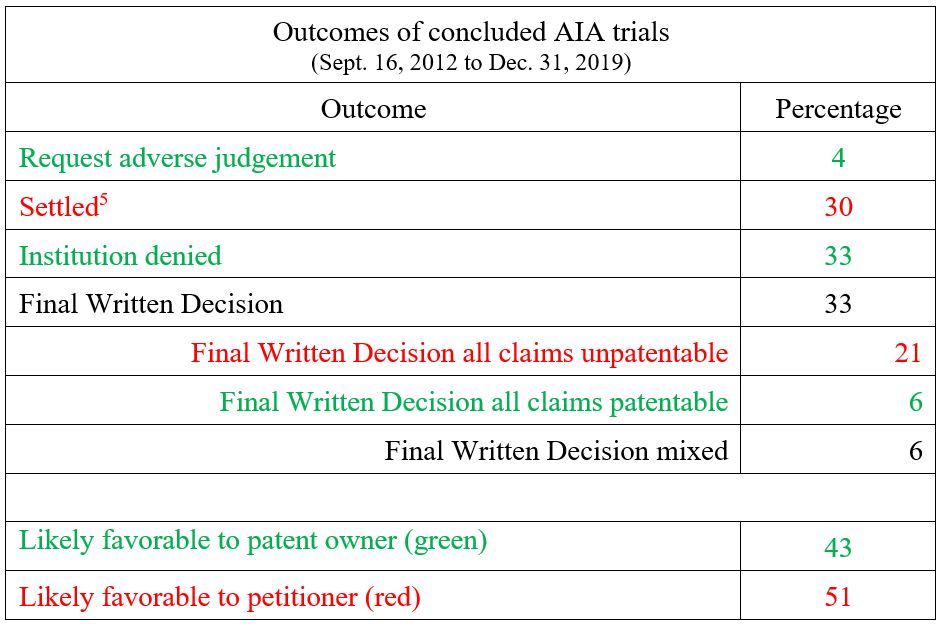
V. Denial of institution and final written decisions are the most common outcomes for AIA trials.
The PTAB trial statistics, which exclude joined and dismissed cases, indicate that only in 21% of AIA trials were all claims found unpatentable. Sixty-three percent of all AIA trials are resolved by denial of institution (33%) and settlement (30%). Only about a third of AIA trials reach a final written decision. Overall, the outcomes of AIA trials appear to be more favorable to the petitioner.
Footnotes
1 Trial Statistics IPR, PGR, CBM, United States Patent and Trademark Office (Dec. 2019).
2 Trial Statistics IPR, PGR, CBM, United States Patent and Trademark Office (Sep. 2019).
3 See Trial Statistics IPR, PGR, CBM, United States Patent and Trademark Office (Dec. 2018).
4 For AIA petitions filed on or after Nov. 23, 2018, the PTAB applies a different claim construction standard viewed as more rigid than the prior broadest reasonable interpretation standard.
5 This data appears to be different than the settlement rate discussed in IV. It is likely that the discrepancy based on how the USPTO calculates settlements. Post-institution "[s]ettlement rate ... is calculated by dividing post-institution settlements by proceedings terminated post-institution (i.e., settled, dismissed, terminated with a request for adverse judgment, and final written decision), excluding joined cases." Pre-institution "[s]ettlement rate ... is calculated by dividing pre-institution settlements by the sum of proceedings instituted, denied institution, dismissed, terminated with a request for adverse judgment, and settled before decision on institution." See Trial Statistics IPR, PGR, CBM, United States Patent and Trademark Office (Dec. 2019).
The content of this article is intended to provide a general guide to the subject matter. Specialist advice should be sought about your specific circumstances.
